
Navigating your Education Insights Premium dashboard
Education Insights Premium provides access to big picture trends in your organization. What you see in your dashboard will be based on your role in your school organization, and the permissions your IT Admin has set up for you.
Overview
-
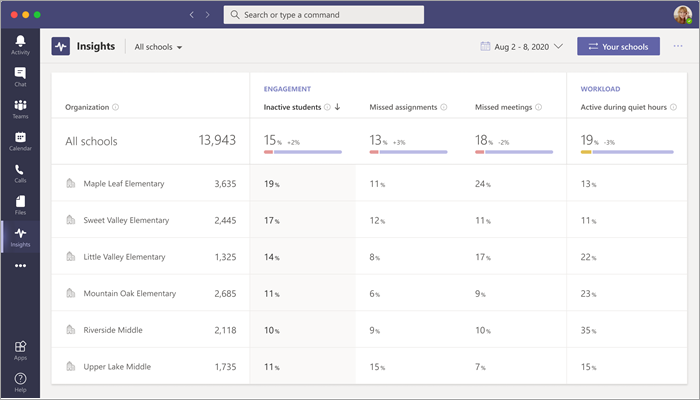
Your overview dashboard shows Digital engagement and Workload data in one view.
-
Hover over the info tips

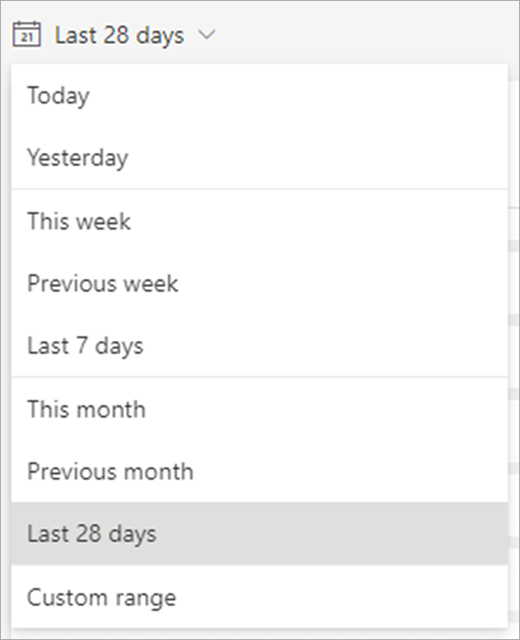
View data from a specific timeframe
-
Time filter: select

-
Select Custom range to enter your own dates for a timeframe of up to 60 days. Timeframes can begin as far back as the beginning of the academic year, as determined by SDS.
-
Note: Percentage data is calculated only for students on the roster the last day of any timeframe you select. If there is no roster data for the timeframe selected, the default timeframe may change accordingly.
Data categories
|
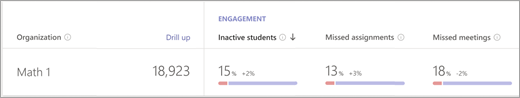
Engagement |
|
|
Workload |
|
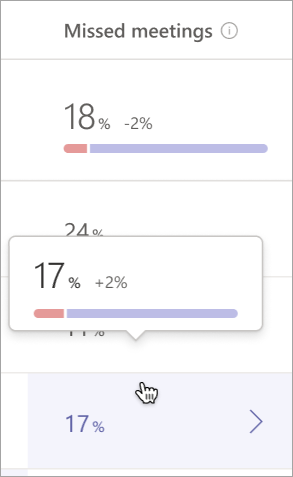
Tip: Hover over a percentage to see more details about the data point's change from the last time period. For example, if you hover over a Missed meetings data point and see 17% next to +2%, that means that 17% of students missed meetings, and that's 2% more students compared to the previous time frame.
Hierarchies in your dashboard:
Note: The organization structure you see in Insights will depend on SDS data provided and permissions set by your IT admin.
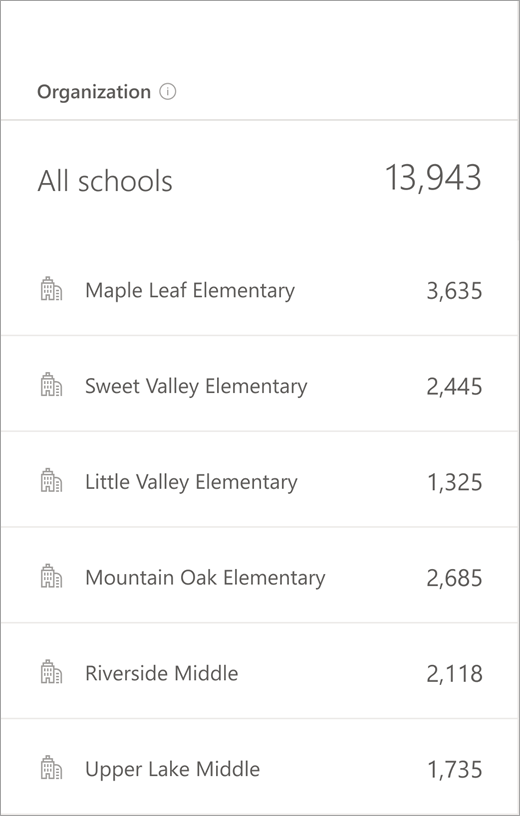
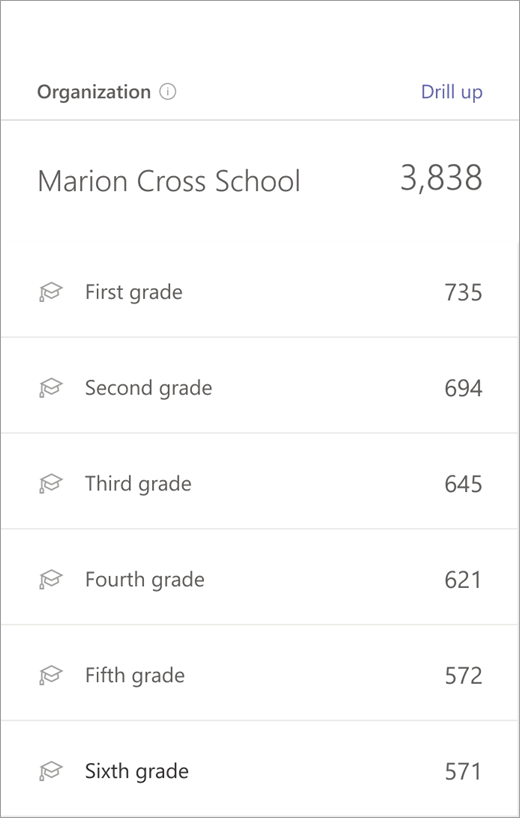
Organization-level data:
-
Your default dashboard will display organization-level data across all schools you have access to.
-
From here you can drill down further to the individual school level. Select a school name to see its data up close (you can also pick a specific school using the school dropdown menu, which is set to All schools by default).
School-level data:
-
School-level data will show data across different grade levels in the individual school you've selected from your main dashboard.
-
Select a grade level to see data across classes within that grade.
-
Select Drill up to return to your organization-wide view.
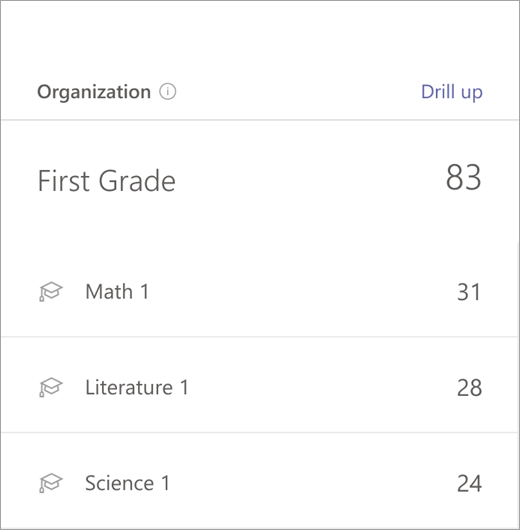
Grade-level data:
-
Grade-level data on your dashboard shows data from the grade you selected from an individual school, across classes in that grade.
-
Select a specific class for its drilled-down student data.
-
Select Drill up to return to the school-level view.
Class-level data:
-
Class-level data on your dashboard shows student data within an individual class.
-
Select Drill up to return to the grade-level view.
Learn More


Need more help?
Want more options?
Explore subscription benefits, browse training courses, learn how to secure your device, and more.


Communities help you ask and answer questions, give feedback, and hear from experts with rich knowledge.


