

If data labels you added to your chart get in the way of your data visualization, or if you want to move them elsewhere, change their placement by choosing another location or dragging them to the desired location.
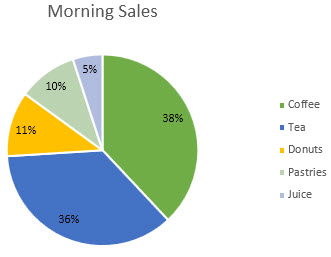
Select all data labels by clicking any data label once, or select a specific data label by double-clicking it.
Right-click the selection, select Chart Elements
 , select the Data Labels arrow, and choose the placement option you want.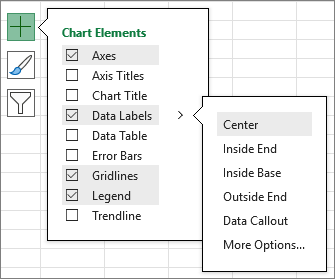
Different options are available for different chart types. For example, you can place data labels outside of the data points in a pie chart but not in a column chart.
Tip
To show your data labels inside a text bubble shape, select Data Callout.
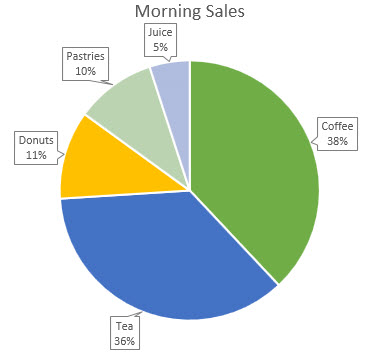
If the labels make your chart look too cluttered, remove any or all of them by selecting the data labels and then pressing Delete.
Tip
If the text inside the data labels is small, click and drag the data labels to the size you want. You can also change their format to make them easier to read.