
Warning: The retired, out-of-support Internet Explorer 11 desktop application has been permanently disabled through a Microsoft Edge update on certain versions of Windows 10. For more information, see Internet Explorer 11 desktop app retirement FAQ.
About this update
To develop great webpages, you need coding expertise, as well as the right tools to find and debug issues that inevitably crop up. This update provides substantial improvements to the F12 developer tools, including both features and bug fixes for the F12 UI, console, DOM explorer, Debugger, Emulation tool, UI Responsiveness, and Memory profiling tools.
Changes to the F12 user interface
New icons and notificationsThe icons for the Memory and Profiler tools have changed.
There are now indicators on the icon bar for errors in the Console, changes in Emulation settings, and for active profiling sessions in the Memory, Profiler, and UI Responsiveness tools. The following image shows the new icons with notifications on the Console and Memory tool icons, indicating that there are two Console errors displayed and that a Memory profiling session is currently in progress: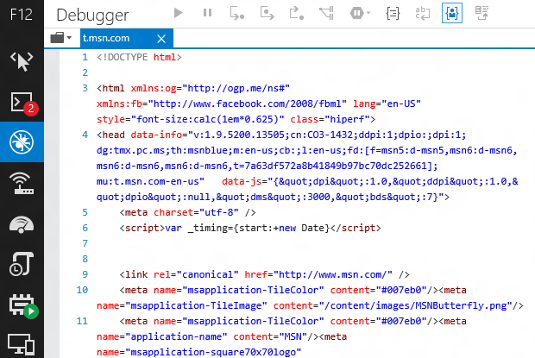
F6 superset navigation within toolsUsing F6 is like using the Tab key to navigate around a tool, but it "tabs" through a selected set of the most commonly used elements in a tool pane rather than through every selectable item. This is part of an overall cleaner system for using the keyboard to navigate within and between tools.
Move back and forth between recently used tools using the keyboardYou can use Ctrl + [ to move backward in your tool navigation history and CTRL + ] to go forward, similar to the back and forward arrows when you are browsing.
Quick access to document modeA new drop-down list is added at the top of the interface that lets you to access to the document mode from any tool, so you do not need to switch tools.
Console changes
Console.timeStamp()When called from the Console or within code, Console.timeStamp() outputs to the Console the number of milliseconds the current browser tab has been open. If it is called while running a profiling session with the UI Responsiveness tool, it creates a user mark on the session's timeline together with a time stamp based on the time since the session started.
Ctrl + L clears the console of all messages
Accurate autocompleteThe Console's autocomplete no longer includes indexer properties. This results in a cleaner and more accurate selection of autocomplete suggestions.
$, $$, $x, $0-$5, and $_ have been added to the Console autocomplete list for convenience, and to make the Console's behavior more consistent with other browsers.
Stale message indicatorIf you have chosen to turn off the Clear on navigate option, older console messages have their icons greyed out to help distinguish between messages for the active page and messages from prior pages in your history.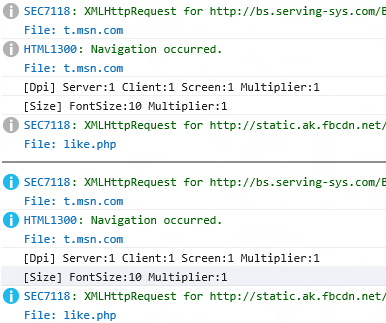
DOM Explorer changes
Change bars in the Computed paneThe change bars (different colors for changed properties, added properties, and deleted properties) that users have been enjoying the Styles pane now appear in the Computed styles pane.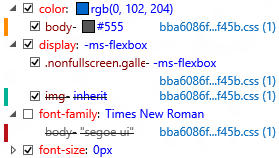
Debugger changes
Source maps designationRight-click a document's tab in the Debugger, and you can specify a source map. This makes it possible to use source maps together with shipped code that has had the source map comment removed.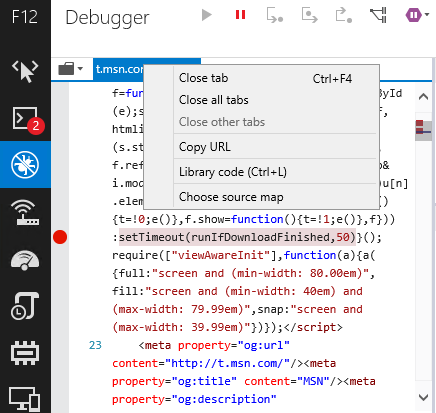
Autocomplete in WatchesNow, when adding a watch, autocomplete options are suggested to you.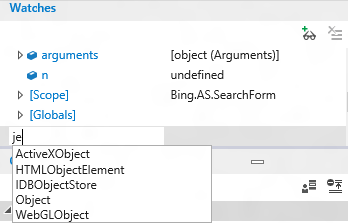
Return value inspectionWhen breaking on a function with a return value, step into the function until you've stepped to the closing brace. The return value will be displayed in the Locals section of the Watches pane. Step again, and the value will be returned to the code that called for it.
For a quick demonstration, try this code in the Console:
function showval() { var x = 0; x++; debugger; return x; } showval(); It will call the function, break on debugger, and you can step into it to see the return value.
Multi-select for breakpointsCtrl + click, Shift + click, and Ctrl + A can be used to select multiple breakpoints in the Breakpoints pane.
Continue and ignore breaksPress F5 to continue to the next break. Hold F5 to continue past multiple breaks until you release F5.
Event breakpoints and tracepointsThese work similar to the breakpoints and tracepoints already present in F12 tools, but instead of being triggered when a specific block of code is executed, they are triggered when a specific event fires. Each has an optional conditional filter to help you narrow their scope to the specific instance of an event that you want to inspect. They can be added using the Add event tracepoint and Add event breakpoint icons highlighted in the following image: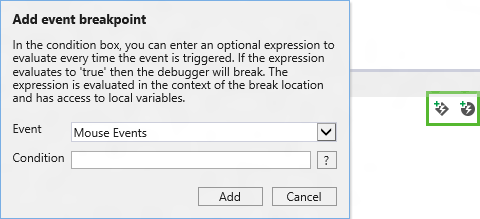
UI Responsiveness tool changes
Import/export performance sessionsYou should not need to reproduce your test case every time you want to analyze the data it produces or share that data with a colleague. The import (folder) and export (disk) icons on the UI Responsiveness tool's icon bar let you save your memory snapshots to a file that can be imported later.
Image previewIf you've seen an HTTP request for an image and wondered which image it was, the image is now previewed in the event details.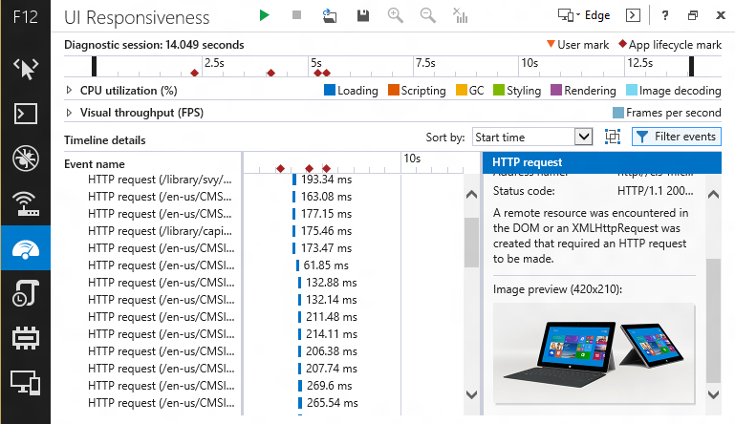
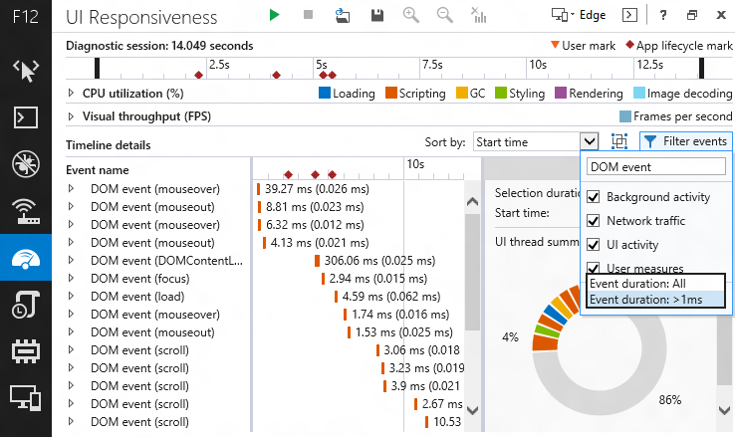
Filtering eventsThe Filter events button is small but powerful. Hidden behind that button is a menu that lets you filter events in multiple ways, and each way has a significant impact:
-
Event name filter: Filter for any event name containing a match for the filter text.
-
UI activity filter: Using the check boxes, you can exclude large categories of events to make it easier to focus on the area you are investigating. For example, if you are only interested in network activity, you can filter out all the noise of the UI and garbage collection.
-
Time threshold filter: This feature filters out top-level events less than one millisecond in duration. In many scenarios, this dramatically simplifies the waterfall view and helps you focus on more impactful events.
HTML5 scripting eventsIf you use media query listeners or MutationObservers, you can now identify their respective costs when you run a performance profiling session.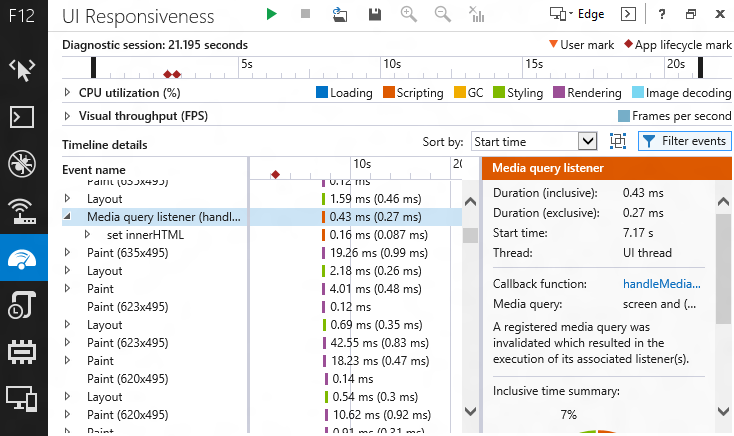
Frame groupingThe button between the Sort by drop-down list and the Filter events menu toggles Frame grouping. This groups top-level events into their corresponding unit of work (or "frame") during periods of time in which animations or visual updates were occurring. The frames are treated like other events, so they can be sorted and filtered, and they provide an Inclusive time summary.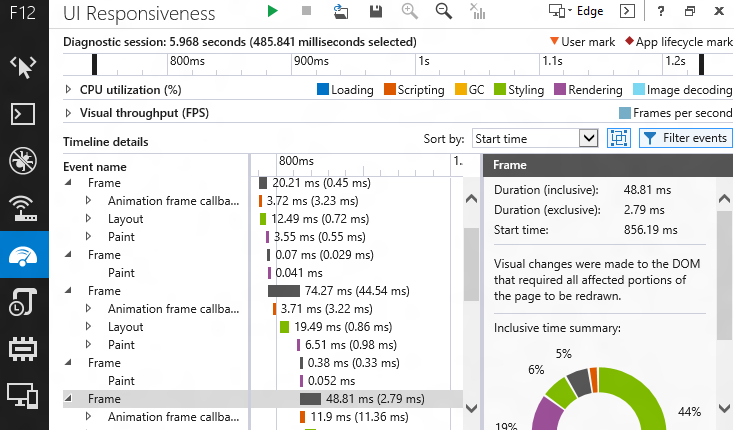
User measuresIf you use the performance.mark() API to add triangles to the timeline to indicate where specific events occurred, the performance.measure() API extends the usefulness of performance marks. Use performance.measure() to create a User measure event encompassing the time between two performance.mark() events, then right-click the event, and then use the Filter to event option to select just the events between the two marks.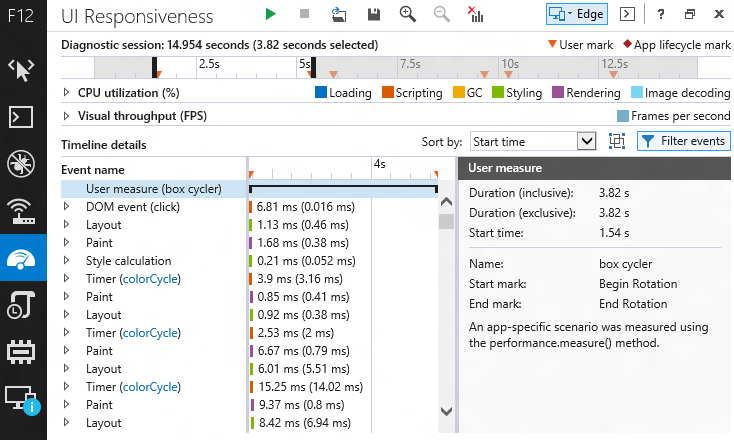
Colorization for DOMThis feature adds colorization to DOM elements, string literals, and number literals. Aside from making the content within the different F12 tools look and behave more alike, it adds more visual interest to the UI Responsiveness tool.
Selection summaryWhen you select a portion of the timeline, the Event details pane will show a summary of the selection. Hover over different segments of the circular chart for a tooltip with the segment's event category.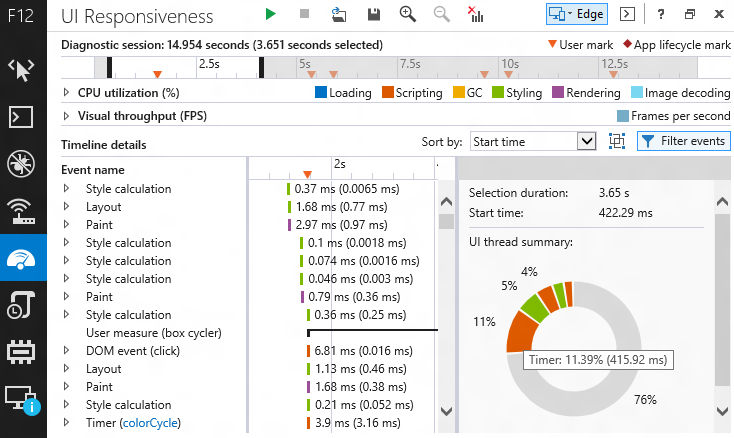
Support for console.timeStamp()Using the console.timeStamp() method in your code or in the console during a profiling session creates a user mark on the timeline that has the time since the profiling session began.
Memory tool changes
Dominator foldingDominator folding helps simplify the contents of a snapshot by removing objects from the top-level views that are logically components of another object (for example, a <BR> within a <DIV>, a Scope held on to by a Function) and tend to be extra details that don’t improve your insight into the data, but could waste your time.
For example, the following image shows before and after views, demonstrating how dominator folding improves the "story" the tool is telling. The folded view shows 30 HTML <DIV> elements, which account for 15.64 megabytes (MB) of memory, and are holding on to detached DOM nodes. In many cases, it isn’t important to know the composition of an object, so much as simply knowing that it is too large or that it is leaking (especially when using third-party libraries).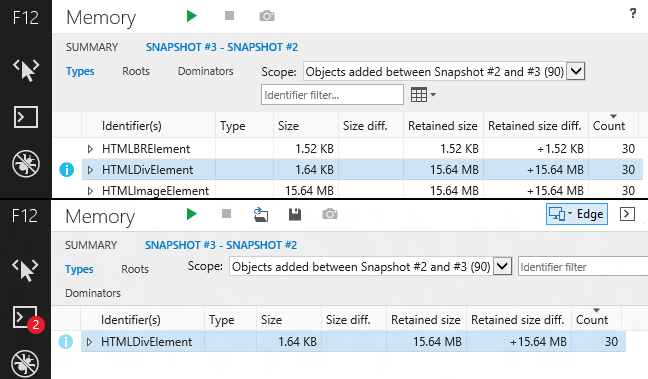
Colorization of DOM, String & Number literalsThis feature adds colorization to DOM elements, string literals, and number literals. Aside from making the content within the different F12 tools look and behave more alike, it makes memory analysis more visually interesting.
Roots cycle filteringWant to be able to investigate the composition of an object without getting unknowingly lost in a circular reference path? This feature detects child references which are circular and "trims" them so that you don’t get confused by traversing them into infinity. Additionally, it annotates these references so that it is clear when a reference has been "trimmed."
Import/export sessionYou should not have to reproduce your test case every time you want to analyze the data it produces or share that data with a colleague. The import (folder) and export (disk) icons on the Memory tool's icon bar let you save your memory snapshots to a file that can be imported later.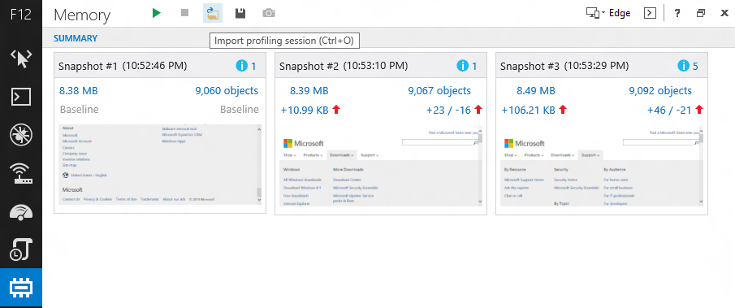
Emulation tool changes
Settings persistence and resetA Persist Emulation settings icon is added to the Emulation tool. This will maintain your current emulation settings until specifically disabled. This allows you to work, close the browser, and then come back with your emulation settings intact. To the right of this icon is a Reset Emulation settings icon, which quickly resets the tool back to default values.
Additionally, this update includes the following improvements based on feedback from the IE Developer Channel:
-
Adds a color picker in the DOM Explorer that allows you to pick colors from any window on your desktop.
-
Adds call stacks from related asynchronous calls for timers and XHR responses.
For more information about using the F12 developer tools in Internet Explorer 11, go to the following Microsoft websites:
Update information
This update was first included in security update 2976627:
2976627 MS14-051: Cumulative security update for Internet Explorer: August 12, 2014
Note If you installed a preview of the F12 developer tools from the IE Developer Channel, you do not need to uninstall that version before installing this update.
To install the most recent cumulative security update for Internet Explorer, go to Microsoft Update.
For technical information about the most recent cumulative security update for Internet Explorer, go to the following Microsoft website:


