
The Viva Engage employee retention metric in Network Analytics shows the difference in the 28-day employee retention rates of employees who do and don't use Viva Engage. Since Viva Engage doesn’t have access to customer human resources data, we impute whether an employee is retained based on whether their Microsoft 365 account is still active and being used. Below we go into finer detail about how the metric is calculated and provide a numerical example.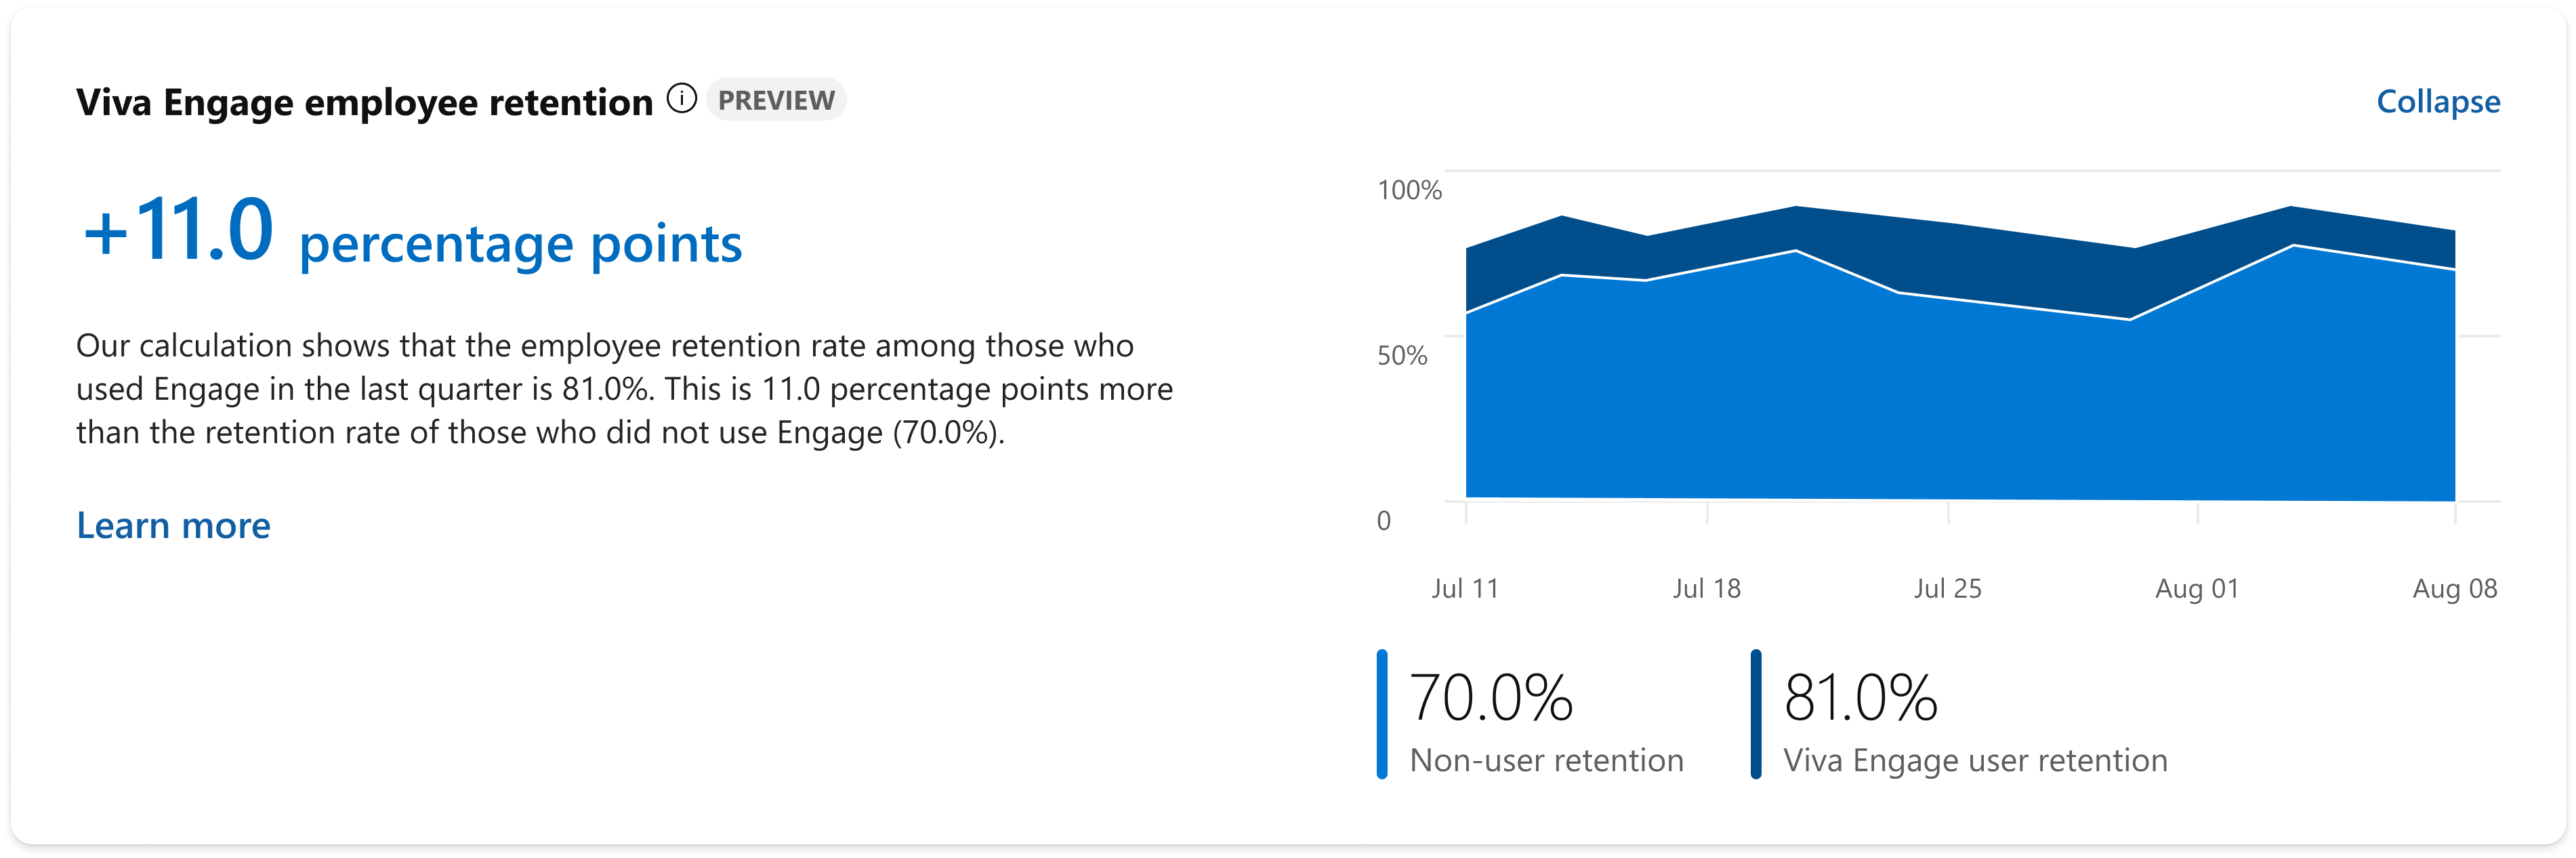
Employee groupings
We first define the employee population for which to calculate retention. To do this, we classify employees into two groups based on Viva Engage and Microsoft 365 usage behavior for an 84-day (~3 month) period.
-
Active on Engage - Employees who perform an action in Viva Engage. Actions can include viewing, writing, or reacting within any Viva Engage platform.
-
Not active on Engage - Employees who have active accounts but don’t perform an action in Viva Engage.
Retention proxy
To measure employee retention, we must impute the date an employee left their company. We assume an employee left (that is, they were not retained) if their Microsoft 365 account was deleted, or they didn’t use a Microsoft app (such as Outlook, Teams, Word, or OneDrive) in the previous 28 days. Because the retention proxy is also dependent on inactivity for at least 28 days, we must wait an additional 28 days after the retention calculation period to verify inactivity.
Calculation and comparison
Finally, for each employee group (Active on Engage and Not Active on Engage), we measure the share of those who were retained in the following 28 days. The metric shown in the Network Analytics dashboard is the percentage point difference in retention rates between those Active on Engage and those Not Active on Engage.
Example
To further illustrate, let’s go through an example of the retention metric calculation.
Population Collection Period
Jan 1 - Mar 25
1,000 employees had active Viva Engage accounts. 800 are classified as Active on Engage and 200 are Not Active on Engage.
28-day Evaluation Period
Mar 26 - Apr 22
In this period, we count how many of these accounts are deleted or had a final Microsoft 365 action.
Inactivity Verification Period
Apr 23 - May 20
To verify that an action is an employee’s last action, we observe their behavior for the following 28 days to ensure that no additional activity occurred.
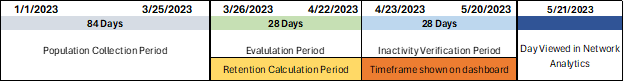
For our example, of all the employees that were counted in the Population Collection Period, 40 Active on Engage employees weren't retained and 20 Not Active on Engage employees weren't retained.
On 5/21, the difference in retention rates for this cohort:
-
95% retention for Active on Engage employees (760/800 = 95%)
-
90% retention for Not Active on Engage employees (760/800 = 90%)
The Retention metric in Network Analytics would show +5.0 percentage points (95% - 90%).


