Prijavite se pomoću Microsofta
Prijavi se ili izradi račun.
Zdravo,
Odaberite drugi račun.
Imate više računa
Odaberite račun putem kojeg se želite prijaviti.
engleski
Nažalost, ovaj članak nije dostupan na vašem jeziku.

Looking for a little help creating a Gantt Chart? Use the Gantt Chart Wizard to end up with the chart you want.

Before you start, you’ll need to add the Gantt Chart Wizard to the Project ribbon.

  1. Select File > Options > Customize Ribbon.

  2. In the right column, select the tab you want to add the Gantt Chart Wizard to (for example, View), and then select New Group.
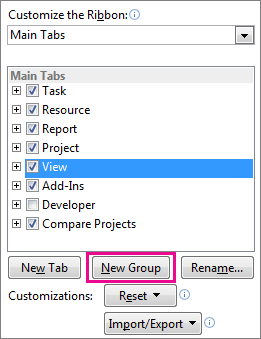
    Create a new group in the Project ribbon.

  3. To give your new group a name (for example, Wizards), select New Group (Custom), select Rename, type your new name, and then select OK.

  4. In the left column, select the arrow under the Choose commands from drop-down menu, and then select Commands Not in the Ribbon.
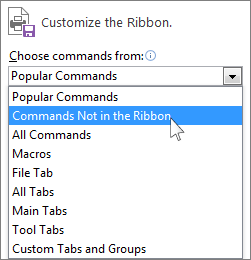
    Choose a command that isn't in the ribbon.

  5. Find and select Gantt Chart Wizard from the list, and then highlight the new group you created in step 2 (it’s in the right column). Select Add, and then select OK.
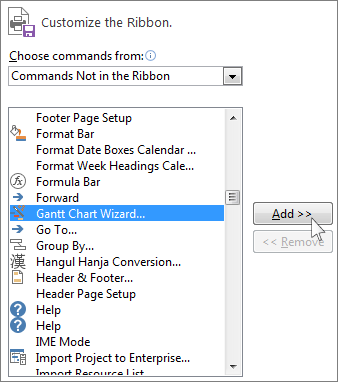
    Add the Gantt Chart Wizard to your new Project ribbon group.

  6. Select the tab where you put the wizard (in this example, we used the View tab), and then select Gantt Chart Wizard. Follow the steps to create your new chart.

    Click Gantt Chart Wizard for help creating your new chart.

Potrebna vam je dodatna pomoć?

Želite dodatne mogućnosti?

Explore subscription benefits, browse training courses, learn how to secure your device, and more.

Communities help you ask and answer questions, give feedback, and hear from experts with rich knowledge.

Jesu li vam ove informacije bile korisne?

Što je utjecalo na vaše iskustvo?
Ako pritisnete Pošalji, vaše će se povratne informacije iskoristiti za poboljšanje Microsoftovih proizvoda i usluga. Vaš će IT administrator moći prikupiti te podatke. Izjava o zaštiti privatnosti.

Hvala vam na povratnim informacijama!

×