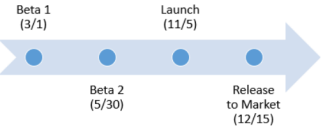
Bruk en SmartArt-grafikk til å opprette en tidslinje som viser måldatoer for en tildeling eller et prosjekt.
Opprette en tidslinje
-
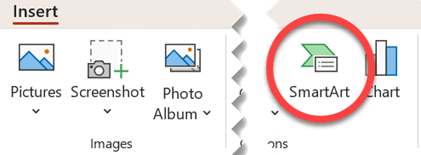
Klikk SmartArt på Sett inn-fanen.
-
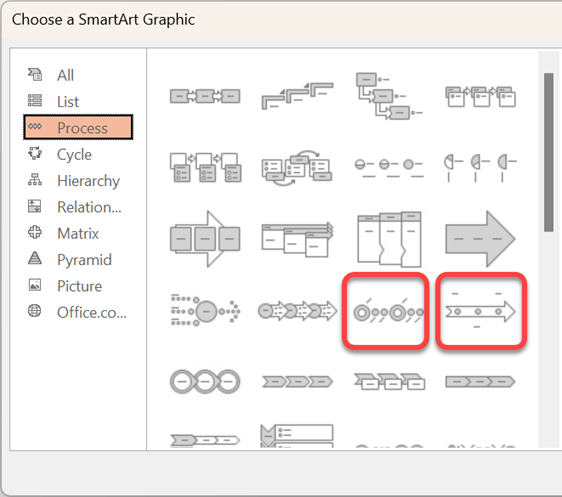
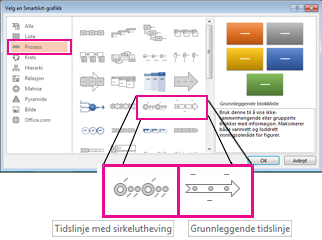
In the Choose a SmartArt Graphic gallery, click Process, and then double-click a timeline layout.
Tips!: There are two timeline SmartArt graphics: Basic timeline and Circle Accent Timeline, but you can also use almost any process-related SmartArt graphic.
-
Click [Text], and then type or paste your text in the SmartArt graphic.
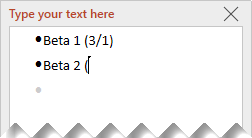
Obs!: You can also open the Text Pane and type your text there. If you do not see the Text Pane, on the SmartArt ToolsDesign tab, click Text Pane.
Add more dates to your timeline
-
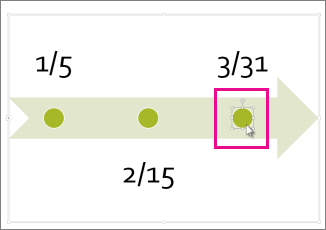
Klikk en figur på tidslinjen.
-
Gjør ett av følgende på SmartArt-utformingsfanen:
-
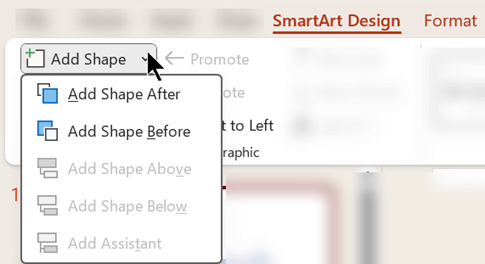
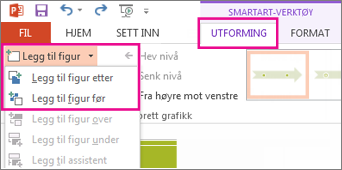
To add an earlier date, click Add Shape, and then click Add Shape Before.
-
To add a later date, click Add Shape, and then click Add Shape After.
-
-
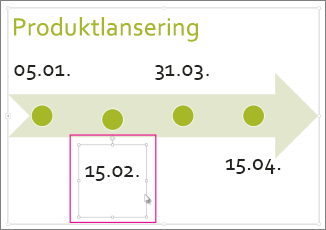
In the new date box, type the date that you want.
Move a date in your timeline
-
On the timeline, click the date you want to move.
-
Gjør ett av følgende på SmartArt-utformingsfanen:
-
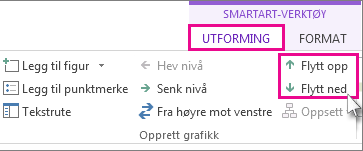
To move a date sooner than the selected date, click Move Up.
-
To move a date later than the selected date, click Move Down.
-
Bytt til et annet tidslinjeoppsett
-
Click the SmartArt graphic timeline.
-
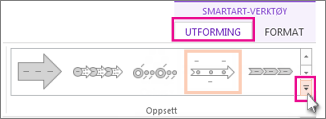
Klikk Mer
Obs!: To view only the timeline and process-related layouts, at the bottom of the layouts list, click More Layouts, and then click Process.
-
Velg en tidslinje eller et prosessrelatert SmartArt-grafikkelement, for eksempel slik:
-
Hvis du vil vise fremdrift på en tidslinje, velger du Uthevingsprosess.
-
Hvis du vil opprette en tidslinje med bilder, klikker du Kontinuerlig bildeliste. Sirkelfigurene er utformet for å inneholde bilder.
-
Endre fargene på tidslinjen
-
Click the SmartArt graphic timeline.
-
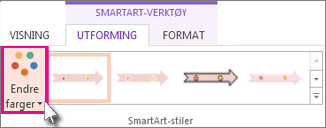
Velg Endre farger på SmartArt-utformingsfanen.
Obs!: Hvis du ikke ser utformingsfanenSmartArt-verktøy, må du kontrollere at du har valgt tidslinjen.
-
Klikk den fargekombinasjonen du ønsker.
Tips!: Place your pointer over any combination to see a preview of how the colors look in your timeline.
Bruk en SmartArt-stil
A SmartArt style applies a combination of effects, such as line style, bevel, or 3-D perspective, in one click, to give your timeline a professionally polished look.
-
Klikk tidslinjen.
-
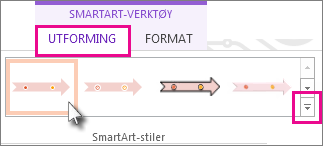
Klikk stilen du vil bruke, på SmartArt-utformingsfanen.
Tips!: Hvis du vil ha flere stiler, klikker du Mer
Se også
Opprette en tidslinje
-
Klikk SmartArt på Sett inn-fanen.
-
In the Choose a SmartArt Graphic gallery, click Process, and then double-click a timeline layout.
Tips!: There are two timeline SmartArt graphics: Basic timeline and Circle Accent Timeline, but you can also use almost any process-related SmartArt graphic.
-
Click [Text], and then type or paste your text in the SmartArt graphic.
Obs!: You can also open the Text Pane and type your text there. If you do not see the Text Pane, on the SmartArt ToolsDesign tab, click Text Pane.
Add more dates to your timeline
-
Klikk en figur på tidslinjen.
-
On the SmartArt ToolsDesign tab, do one of the following:
-
To add an earlier date, click Add Shape, and then click Add Shape Before.
-
To add a later date, click Add Shape, and then click Add Shape After.
-
-
In the new date box, type the date that you want.
Move a date in your timeline
-
On the timeline, click the date you want to move.
-
On the SmartArt ToolsDesign tab, do one of the following:
-
To move a date sooner than the selected date, click Move Up.
-
To move a date later than the selected date, click Move Down.
-
Bytt til et annet tidslinjeoppsett
-
Click the SmartArt graphic timeline.
-
Klikk Mer
Obs!: To view only the timeline and process-related layouts, at the bottom of the layouts list, click More Layouts, and then click Process.
-
Velg en tidslinje eller et prosessrelatert SmartArt-grafikkelement, for eksempel slik:
-
Hvis du vil vise fremdriften på en tidslinje, klikker du Uthevingsprosess.
-
Hvis du vil opprette en tidslinje med bilder, klikker du Kontinuerlig bildeliste. Sirkelfigurene er utformet for å inneholde bilder.
-
Endre fargene på tidslinjen
-
Click the SmartArt graphic timeline.
-
On the SmartArt ToolsDesign tab, click Change Colors.
Obs!: Hvis du ikke ser utformingsfanenSmartArt-verktøy, må du kontrollere at du har valgt tidslinjen.
-
Klikk den fargekombinasjonen du ønsker.
Tips!: Place your pointer over any combination to see a preview of how the colors look in your timeline.
Bruk en SmartArt-stil
A SmartArt style applies a combination of effects, such as line style, bevel, or 3-D perspective, in one click, to give your timeline a professionally polished look.
-
Klikk tidslinjen.
-
On the SmartArt ToolsDesign tab, click the style you want.
Tips!: Hvis du vil ha flere stiler, klikker du Mer
Se også
Opprette en tidslinje
-
Klikk Smartart på Sett inn-fanen.
-
Velg et tidslinjeoppsett fra galleriet som vises, for eksempel denne grunnleggende tidslinjen i listedelen .
På lysbildet åpnes et tekstredigeringsprogram ved siden av grafikken, slik at du enkelt kan legge til ord i grafikken.
-
Skriv inn datoene og beskrivelsene i tekstredigeringsprogrammet, og trykk deretter enter.
-
Du kan eventuelt lage et delelement i punktlisten ved å klikke punktet med teksten du vil bruke for et delelement, og klikke Senket nivå på Smartart-fanen.
Endre fargen eller stilen på en tidslinje
Du kan endre fargen eller stilen på tidslinjegrafikken. Du kan også velge et helt annet grafikkoppsett.
-
Velg tidslinjen.
-
Velg SmartArt-fanen på båndet, og velg deretter endre farger eller stiler for å se en meny med tilgjengelige alternativer for tidslinjegrafikken. Klikk stilen eller fargen du vil merke.
-
Du kan også prøve å endre oppsettet ved å åpne oppsettgalleriet til venstre for Endre farger. Noen av alternativene i liste- og prosessdelene i galleriet er egnet for tidslinjer.
Endre størrelse på tidslinjen
Du kan endre størrelsen på grafikken slik at den passer bedre på lysbildet.
-
Velg tidslinjen.
-
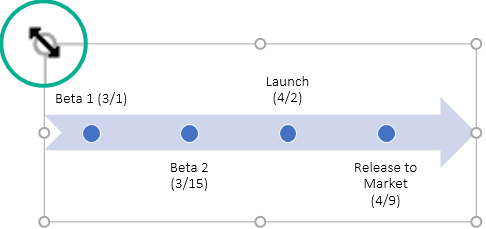
Pek på et av skaleringshåndtakene i hjørnet til du ser den tohodede pilen, og klikk og dra for å endre størrelsen på tidslinjen.

