
Error bars graphically express potential error amounts relative to each data marker in a data series. For example, you could show 5 percent positive and negative potential error amounts in the results of a scientific experiment:
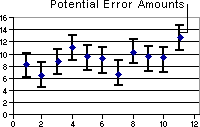
Chart types that support error bars You can add error bars to data series in 2-D area, bar, column, line, xy (scatter), and bubble charts. For xy (scatter) and bubble charts, you can display error bars for the x values, the y values, or both.