Sign in with Microsoft
Sign in or create an account.
Hello,
Select a different account.
You have multiple accounts
Choose the account you want to sign in with.

You can make a chart in Word. If you have lots of data to chart, create your chart in Excel, and then copy from Excel to another Office program. This is also the best way if your data changes regularly and you want your chart to always reflect the latest numbers. In that case, when you copy the chart, keep it linked to the original Excel file.

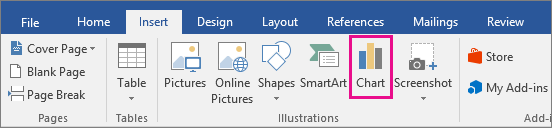
To create a simple chart from scratch in Word, click Insert > Chart, and pick the chart you want.

  1. Click Insert > Chart.

    The Chart option is highlighted on the Insert tab
  2. Click the chart type and then double-click the chart you want.

    Insert Chart dialog box

    Tip: For help deciding which chart is best for your data, see Available chart types.

  3. In the spreadsheet that appears, replace the default data with your own information.

    The spreadsheet that appears after picking the chart you want.

    Tip: When you insert a chart, small buttons appear next to its upper-right corner. Use the Chart Elements Chart Elements button button to show, hide, or format things like axis titles or data labels. Or use the Chart Styles Customize the Look of Your Chart button button to quickly change the color or style of the chart. The Chart Filters Chart Filters button button is a more advanced option that shows or hides data in your chart.

  4. When you’ve finished, close the spreadsheet.

  5. If you want, use the Layout Options button Layout Options button to arrange the chart and text in your document.

You can make a chart in Word or Excel. If you have lots of data to chart, create your chart in Excel, and then copy from Excel to another Office program. This is also the best way if your data changes regularly and you want your chart to always reflect the latest numbers. In that case, when you copy the chart, keep it linked to the original Excel file.

To create a simple chart from scratch in Word, click Insert > Chart and pick the chart you want.

  1. Click Insert > Chart.

    Chart button in the Illustrations group on the Insert tab in Word
  2. Click the chart type and then double-click the chart you want.

    Insert Chart dialog box

    Tip: For help deciding which chart is best for your data, see Available chart types.

  3. In the spreadsheet that appears, replace the default data with your own information.

    The spreadsheet that appears after picking the chart you want.

    Tip: When you insert a chart, small buttons appear next to its upper-right corner. Use the Chart Elements Chart Elements button button to show, hide, or format things like axis titles or data labels. Or use the Chart Styles Customize the Look of Your Chart button button to quickly change the color or style of the chart. The Chart Filters Chart Filters button button is a more advanced option that shows or hides data in your chart.

  4. When you’ve finished, close the spreadsheet.

  5. If you want, use the Layout Options button Layout Options button to arrange the chart and text in your document.

Important:  Office 2010 is no longer supported. Upgrade to Microsoft 365 to work anywhere from any device and continue to receive support.

Upgrade now

In Microsoft Word 2010, you can insert many kinds of data charts and graphs, such as column charts, line graphs, pie charts, bar charts, area graphs, scatter graphs, stock charts, surface charts, doughnut charts, bubble graphs, and radar graphs.

Notes: 

  • Don't see the chart that you want in this article?     For more information about the variety of graphs and charts you can use, see Available chart types.

  • Want to create an organization chart?     For more information about how to create organization charts, see Create an organization chart.

  • If Microsoft Excel 2010 isn't installed on your computer, you will not be able to take advantage of the advanced data charting capabilities in the Microsoft Office 2010. Instead, when you create a new data chart in Word 2010, Microsoft Graph opens.

How?

Icon image

On the Insert tab, in the Illustrations group, click Chart.

office 14 ribbon

Icon image

In the Insert Chart dialog box, click the arrows to scroll through the chart types.

Select the type of chart that you want and then click OK.

You can choose from many different types of graphs in the Insert Chart dialog box

When you rest the mouse pointer over any chart type, a ScreenTip displays its name.

Tip: For more information on chart types, see Available chart types.

Icon image

Edit the data in Excel 2010.

When you are finished editing your data, you can close Excel.

Sample data for a chart

Sample data in an Excel worksheet

Tips

  • To get a good idea of what you can add to or change in your chart, under Chart Tools, click the Design, Layout, and Format tabs, and then explore the groups and options that are provided on each tab.

    Note: If you don't see the Chart Tools, make sure that you click anywhere inside the chart to activate it.

    Chart Tools

  • You can also access design, layout, and formatting features that are available for specific chart elements (such as chart axes or the legend) by right-clicking those chart elements.

More information

Top of Page

See also

Present data in a chart

Need more help?

Want more options?

Explore subscription benefits, browse training courses, learn how to secure your device, and more.

Communities help you ask and answer questions, give feedback, and hear from experts with rich knowledge.

Was this information helpful?

What affected your experience?

Thank you for your feedback!

×