

Try it!
Excel's Quick Analysis button lets you instantly create different types of charts, including line and column charts, or add miniature graphs called sparklines.
-
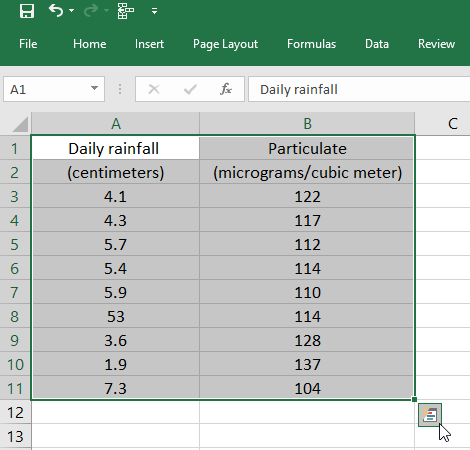
Select a range of cells.
-
Select the Quick Analysis button that appears at the bottom right corner of the selected data.
Or, press Ctrl + Q.
-
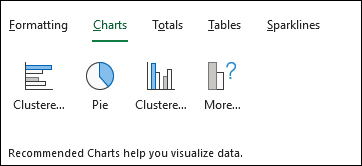
Select Charts.
-
Hover over the chart types to preview a chart, and then select the chart you want.
Want more?


Need more help?
Want more options?
Explore subscription benefits, browse training courses, learn how to secure your device, and more.


Communities help you ask and answer questions, give feedback, and hear from experts with rich knowledge.


