Use the Marketing Charts and Diagrams template to create drawings for process modeling, benchmarking, simulation and improvement, path routing, time and cost analysis, activity-based costing, product portfolios, scope and marketing mix, product life and adoption cycles, market and resource analysis, and pricing matrices.
The following drawings can be built from the Marketing Charts and Diagrams template:
Note: The Marketing Charts and Diagrams drawing is available under the Business category.
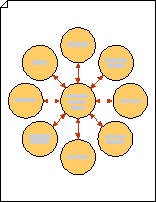
Create a circle-spoke drawing
-
In Marketing Diagrams on the Shapes pane, drag the Circle-spoke diagram shape onto the drawing page. Choose the number of outer circles you want, and then click OK.
Tip: To add or delete outer circles later, right-click the circle-spoke diagram, click Set Number of Circles, and then select a different number of circles.
-
Drag a selection handle to resize the circle-spoke diagram as needed.
-
Reposition an outer circle by dragging the yellow control handle in the center of it.
-
To add text to a circle, select an individual circle and right-click and select Edit Text, and then type the text.
Create a market analysis drawing
-
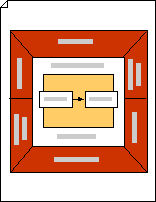
In Marketing Diagrams on the Shapes pane, drag the Market analysis shape onto the drawing page.
-
To resize the shape, drag a selection handle.
-
To add text to a region in a market analysis shape, select the shape, right-click and select Edit Text, and then type the text.
Notes:
-
Text added to the inner boundary of a market analysis shape may be hidden behind the center rectangle. Use the Text Block tool

-
The center rectangle of a market analysis shape can also be used to display graphic elements, such as rectangles and arrows that represent a process.
-
Create a marketing mix drawing
-
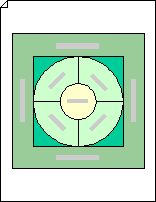
In Marketing Diagrams on the Shapes pane,, drag the Marketing Mix shape onto the drawing page. Drag selection handles to resize the shape.
-
To replace text, select a shape and then right-click and select Edit Text, and then type the text.
-
To change the color of the shape, select the shape, then right-click and select Format Shape. In the Format Shape pane, expand Fill and select a color.
Tip: You can add other shapes such as rectangles and squares to your diagram, and then create layers using different colors and text to add additional information to your Marketing Mix diagram.
Create a matrix
-
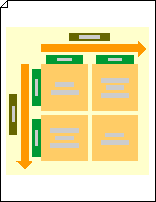
In Marketing Diagrams on the Shapes pane, drag the Matrix shape onto the drawing page. Drag a corner selection handle on the shape to resize it as needed.
-
To add text to the matrix, select a square or label, then right-click and select Edit Text. Then type to replace existing text.
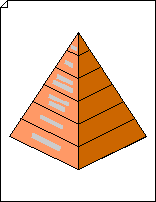
Create a pyramid drawing
-
In Marketing Diagrams on the Shapes pane, drag the Triangle or 3-D pyramid shape onto the drawing page. Select the number of levels you want, and then click OK.
-
To resize a triangle or pyramid, drag a selection handle.
-
To add text to a triangle or pyramid, right-click and select Edit Text, and then type the text you want.
-
To add a title, from Borders and Titles, drag a Title block shape onto the page. With the shape selected, type a title.
Notes:
-
If you have created a triangle, use the shortcut menu (that means, right-click on the triangle) to change the number of levels, add space between the levels, and switch from a 3-D to a 2-D appearance.
-
To change the color of a pyramid, right-click the 3-D pyramid shape, and then click Set pyramid color. Select the color you want, and then click OK.


