

Try it!
A PivotTable is a powerful tool to calculate, summarize, and analyze data that lets you see comparisons, patterns, and trends in your data.
Create a PivotTable
-
Select the cells you want to create a PivotTable from.
Note: Your data shouldn't have any empty rows or columns. It must have only a single-row heading.
-
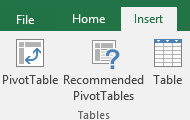
Select Insert > PivotTable.
-
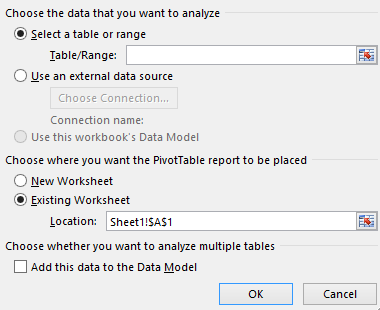
Under Choose the data that you want to analyze, select Select a table or range.
-
In Table/Range, verify the cell range.
-
Under Choose where you want the PivotTable report to be placed, select New worksheet to place the PivotTable in a new worksheet or Existing worksheet and then select the location you want the PivotTable to appear.
-
Select OK.
Building out your PivotTable
-
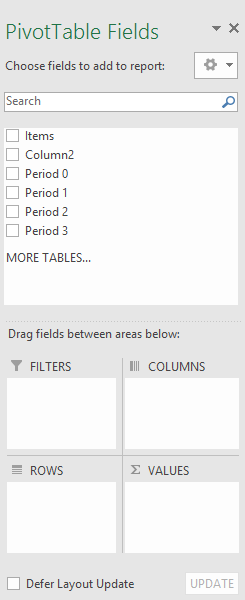
To add a field to your PivotTable, select the field name checkbox in the PivotTables Fields pane.
Note: Selected fields are added to their default areas: non-numeric fields are added to Rows, date and time hierarchies are added to Columns, and numeric fields are added to Values.
-
To move a field from one area to another, drag the field to the target area.
Want more?


Need more help?
Want more options?
Explore subscription benefits, browse training courses, learn how to secure your device, and more.


Communities help you ask and answer questions, give feedback, and hear from experts with rich knowledge.


