
You can create a simple organization chart in a publication by using shapes to represent manager positions and reporting positions, and then connecting them with connector lines.
Build the organization chart
Add shapes
-
On the Insert menu, click Shapes, and then click the shape you want to insert.
-
Click in the publication where you wan to insert the shape.
-
Change the size, color, fill, or line of the shape.
-
Right-click the shape, and then click Format AutoShape.
-
In the Format AutoShape dialog box , select the options that you want. For example, to change the fill, click the Colors and Lines tab. Under Fill, click a new color in the Color list or click Fill Effects to create a texture, pattern, or gradient.
-
-
When the shape looks the way you want for your chart, right-click the shape, and then click Copy.
-
Right-click where you want to place a copy of the object, and then click Paste.
-
Repeat step 5 and until you have all the shapes you want for your chart.
Connect the shapes
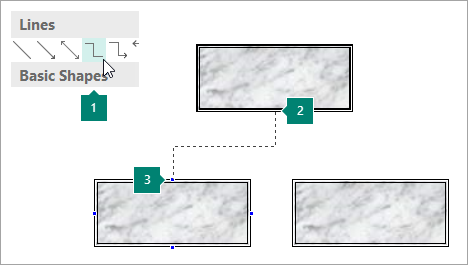
1 Choosing a connector line
2 First connection site
3 Second connection site; connection sites appear blue when you point to a shape.
-
On the Insert menu, click Shapes, and then click the connector line that you want, such as Elbow.
-
Point to where you want to attach the connector, such as at the bottom of your top manager position shape in the organization chart.
Connection sites appear blue when you point to a shape.
-
Click the first connection site, point to the second object (such as the first reporting position shape in your organization chart), and then click the second connection site.
-
Repeat steps 1-3 to add all the connector lines that you want.
-
Optional: Change the color or weight of the connector lines.
-
Select the connector lines that you want to change. To select multiple connectors, hold down SHIFT while you click each connector line.
-
Right-click, click Format AutoShape, and then click the Colors and Lines tab.
-
Under Line, select the options that you want.
-
Add text
-
To add text to a shape in the organization chart, click the shape, and then type the text that you want.
-
To format the text, select the text inside the shape, and then use the options on the Text Box Tools Format tab.
Move shapes and connector lines in the organization chart
Now that you have added shapes and connectors for your organization chart, you may want to fine-tune the placement of each piece.
Move a shape
-
Click the shape that you want to move.
-
Do one of the following:
Drag the shape to a new position
-
Position the mouse pointer over the shape. When the pointer becomes a

Note: If one of the Snap commands is turned on, the shape might snap to the nearest guide, shape, or ruler mark when you release the mouse button.
Nudge a shape
-
Press one of the arrow keys to move the shape in that direction.
The object moves a set distance each time you press an arrow key. The default nudge distance is 0.13 inch (or its equivalent if you are using another unit of measure). However, you can change the nudge distance.
-
Click File > Options > Advanced.
-
Under Editing options, select the Nudge objects by check box, and then type the distance that you want objects to move when you nudge them.
-
Position an object precisely on the page
-
Right-click the shape.
-
On the shortcut menu, click Format AutoShape, and then click the Layout tab.
-
Under Position on page, type the positive measurements for the horizontal and vertical placement of the object or object group.
-
Click OK.
Tip: When you click an object, you can see its exact position on the status bar at the bottom of the window.
-
Move a connector
-
Click the connector that you want to move.
-
Do one or both of the following:
-
To move one end of the connector, rest the pointer over the end that you want to move until the pointer becomes a crosshairs, and then drag the end and connect it to a different point.
To override the automatic connecting, hold down ALT while you drag the end of the connector. You can place the end wherever you want on the object, but the end will not be connected.
-
To detach the entire connector line, drag it by the middle (not by the yellow diamond).
-
Work with the organization chart as a single object
When the organization chart looks the way you want it, you may want to group all the shapes and connector lines together as a single object. Grouping the objects makes it easier to move and size the entire organization chart, and it helps to avoid moving shapes or connector lines inadvertently.
Group objects
-
Drag your mouse pointer to draw a selection box around the shapes and connector lines in your organization chart.
-
On the Drawing Tools Format tab, click Group.
If you need to make changes to the chart, you can ungroup the shapes and connectors by clicking Ungroup.
Set up the publication for building your organization chart
Before you build your chart, display the Basic Shapes and Connectors submenus as floating toolbars so that you don't have to display the submenus each time you want to add a shape or connector line.
-
Open or create the publication you want to add the organization chart to.
-
On the Objects toolbar, click AutoShapes

-
Drag the move handle

The Connectors submenu becomes a floating toolbar.
-
On the Objects toolbar, click AutoShapes
-
Drag the move handle
The Basic Shapes submenu becomes a floating toolbar.
Build the organization chart
Now that the Connectors and Basic Shapes toolbars are displayed, you are ready to build the organization chart.
Create the shapes
-
On the Basic Shapes toolbar, click the shape you want in your organization chart, such as Rectangle

-
Change the size, color, fill, or line of the shape.
how
-
Right-click the shape, and then click Format AutoShape.
The Format AutoShape dialog box appears.
-
Select the options that you want. For example, to change the fill, click the Colors and Lines tab. Under Fill, click a new color in the Color list or click Fill Effects to create a texture, pattern, or gradient.
-
-
When the shape looks the way you want for your chart, right-click the shape, and then click Copy.
-
Right-click where you want the object, and then click Paste.
-
Repeat step 4 until you have all the shapes you want for your chart.
Connect the shapes
1 Connector line
2 First connection site
3 Second connection site; connection sites appear as blue circles when you point to a shape.
-
On the Connectors toolbar, double-click the connector line that you want, such as Elbow Connector.
Note: When you double-click a connector line, the button stays selected while you add the connectors you want.
-
Point to where you want to attach the connector, such as at the bottom of your top manager position shape in the organization chart.
Connection sites appear as blue circles when you point to a shape.
-
Click the first connection site you want, point to the other object (such as the first reporting position shape in your organization chart), and then click the second connection site.
-
Repeat steps 2–3 to add all the connector lines that you want.
-
After you add the connector lines that you want, either click the connector line that you selected on the Connectors toolbar in step 1 or press ESC to cancel the selection of the connector line button.
-
Change the color or weight of the connector lines.
-
Select the connector lines that you want to change. To select multiple connectors, hold down SHIFT while you click each connector line.
-
On the Format menu, click AutoShape, and then click the Colors and Lines tab.
-
Under Line, select the options that you want.
-
Add text
-
To add text to a shape in the organization chart, click the shape, and then type the text that you want.
-
To format the text, select the text inside the shape, and then use the options on the Formatting toolbar.
Move shapes and connector lines in the organization chart
Now that you have added shapes and connectors for your organization chart, you may want to fine-tune the placement of each piece.
Move a shape
-
Click the shape that you want to move.
-
Do one of the following:
Drag the shape to a new position
-
Position the mouse pointer over the shape. When the pointer becomes a
Note: If one of the Snap commands is turned on, the shape might snap to the nearest guide, shape, or ruler mark when you release the mouse button.
Nudge a shape
-
Press one of the arrow keys to move the shape in that direction.
The object moves a set distance each time you press an arrow key. The default nudge distance is 0.13 inch (or its equivalent if you are using another unit of measure). However, you can change the nudge distance.
-
On the Tools menu, click Options, and then click the Edit tab.
-
Select the Arrow keys nudge objects by check box, and then type the distance that you want objects to move when you nudge them.
-
Position an object precisely on the page
-
Right-click the shape.
-
On the shortcut menu, click Format AutoShape, and then click the Layout tab.
-
Under Position on page, type the positive measurements for the horizontal and vertical placement of the object or object group.
-
Click OK.
Tip: When you click an object, you can see its exact position on the status bar at the bottom of the window.
-
Move a connector
-
Click the connector that you want to move.
-
Do one or both of the following:
-
To move one end of the connector, rest the pointer over the end that you want to move until the pointer becomes a crosshairs, and then drag the end and connect it to a different point.
To override the automatic connecting, hold down ALT while you drag the end of the connector. You can place the end wherever you want on the object, but the end will not be connected.
-
To detach the entire connector line, drag it by the middle (not by the yellow diamond).
-
Work with the organization chart as a single object
When the organization chart looks the way you want it, you may want to group all the shapes and connector lines together as a single object. Grouping the objects makes it easier to move and size the entire organization chart, and it helps to avoid moving shapes or connector lines inadvertently.
Group objects
-
On the Objects toolbar, click the Select Objects tool

-
Below the selection box, click Group Objects

If you need to make changes to the chart, you can ungroup the shapes and connectors.
Ungroup objects
-
Select the grouped objects (the organization chart).
-
Below the selection box, click Ungroup Objects


