Venn diagrams in Visio use overlapping shapes, usually circles, to explain and illustrate the relationships, similarities, and differences between sets or groups. You can create Venn diagrams using a template, or build a custom diagram with as many or as few shapes as you want.
In this article:
Create Venn diagrams using a template
Use the Venn starter diagram when you want to get going quickly. Customize the diagram by adding your own text and colors.
-
In Visio, on the File menu, click New > Business, and then click Marketing Charts and Diagrams.
-
Choose between Metric Units or US Units, and click Create.
-
From Marketing Diagrams, drag the Venn diagram shape onto the page.
-
Click a segment to select.
-
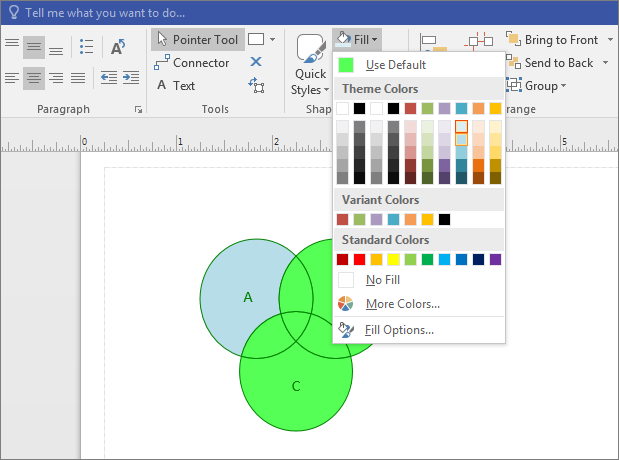
Click Fill in the Shape Styles area, and select a color.
-
Click another segment.
-
Click Fill, and select a different color.
-
To add text to a segment or to the overlapping area of the segments, select the Venn diagram, click the segment or overlapping segments, and type the text.
Create Venn diagrams from scratch
If the Venn starter diagram does not fit your needs, build your own Venn diagram from the ground up. By customizing Microsoft Visio, you can include as many or as few groups as you want.
-
In Visio, on the File menu, click New, and then click Basic Diagram.
-
Choose between Metric Units or US Units, and click Create.
-
Click the File tab.
-
Click Options.
-
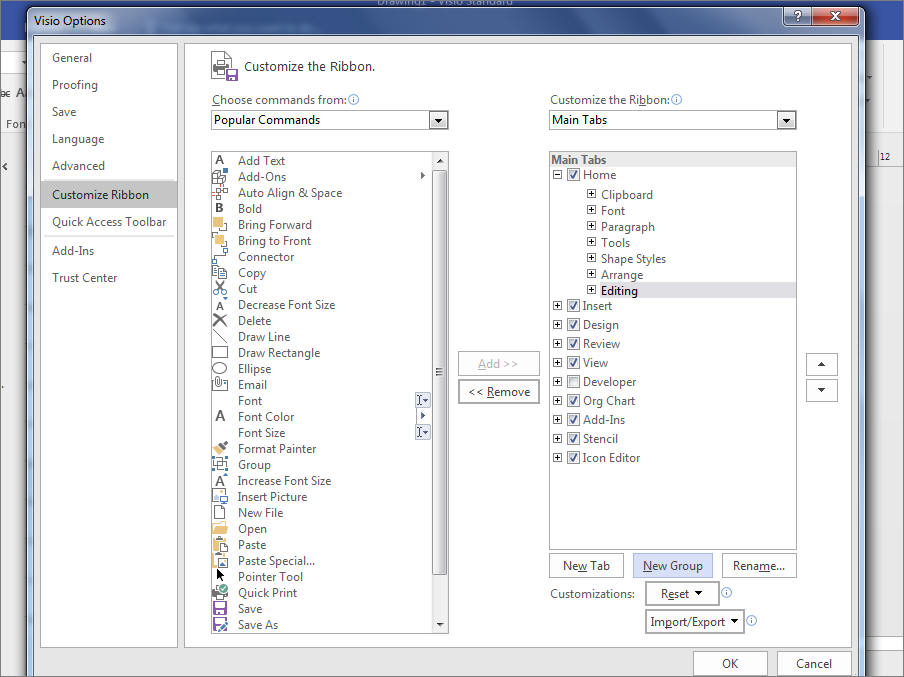
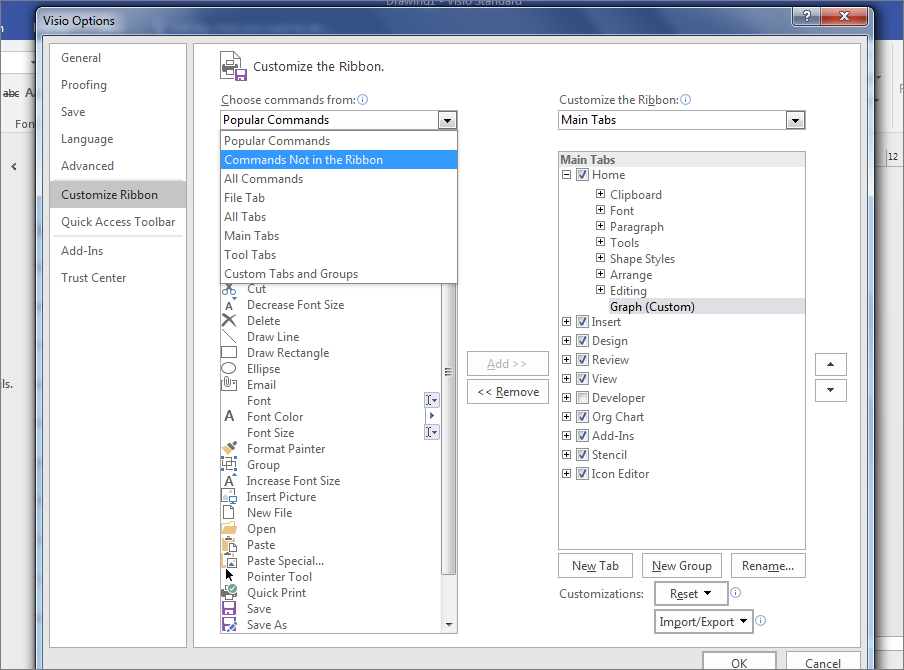
On the Visio Options screen, click Customize Ribbon.
-
Click the New Group button.
-
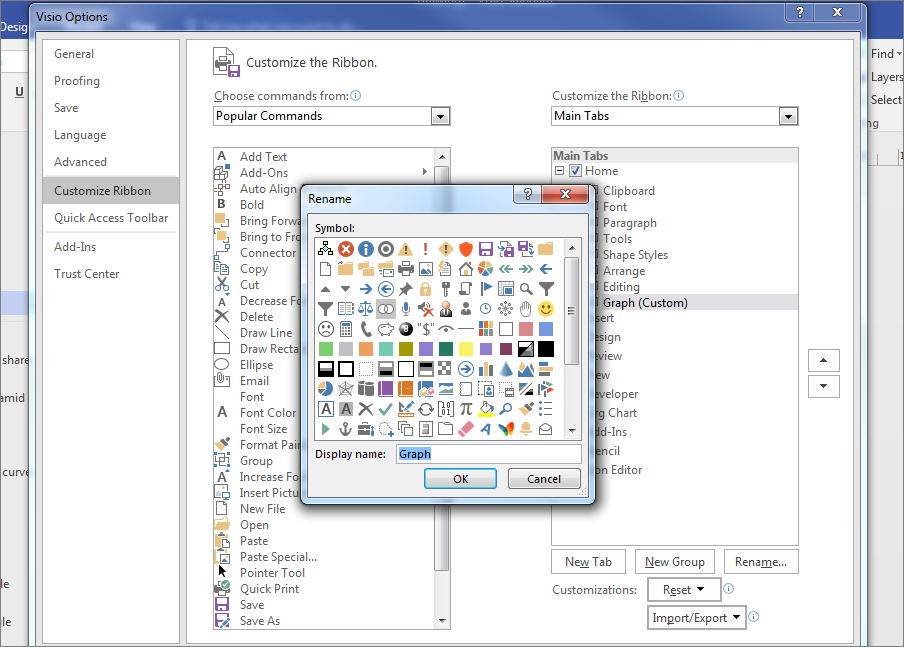
Click the Rename button.
-
Click the Venn icon, and then type Graph into the Display name field, and click OK.
-
Under Choose commands from, select Commands Not in the Ribbon from the drop-down.
-
Scroll down the list and select Fragment Shapes.
-
Click Add, and then click OK.
Tips:
-
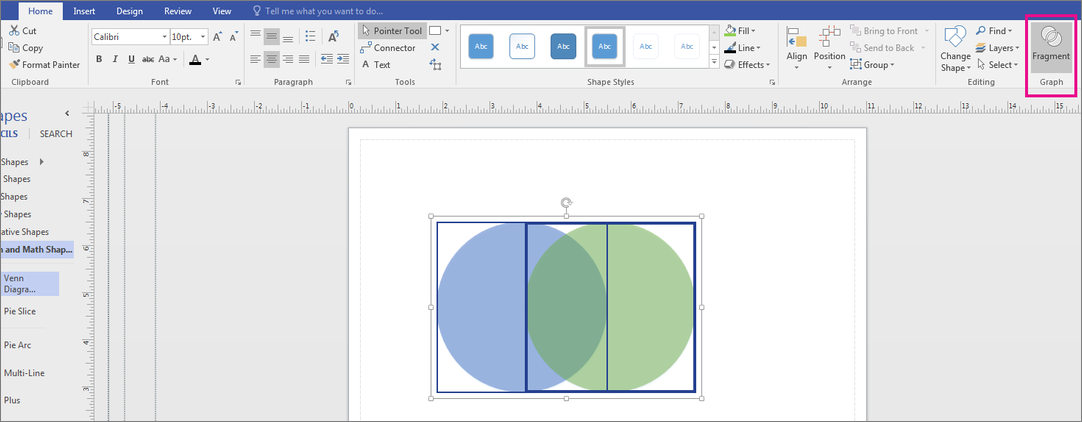
Fragment in the Graph area appears on the Visio Home tab.
-

-
-
Click the Graph and Math Shapes stencil.
-
Drag a Venn Diagram shape onto the page.
-
Drag another Venn Diagram shape onto the page, and place it next to the first circle so that the edges overlap. Continue dragging Venn Diagram shapes onto the page until you have as many as you want.
-
On the Home tab, click Select in the Editing group, and click Select, then Select All in the list.
-
Click Fragment in the Graph area.
-
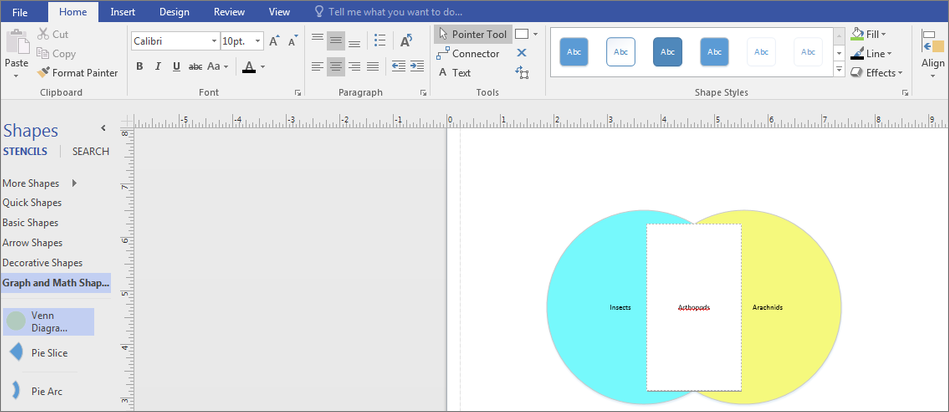
Click the individual segments to change the fill color or to add text.
-
Open Visio for the web and scroll down near the bottom of the page to the Venn Diagrams section.
The first option gives you a blank diagram and stencil with several Venn shapes. The other options give you the stencil plus a starter diagram that you can adapt from. Click any option to see a preview of it.
-
Select the option you want and then click Create.
-
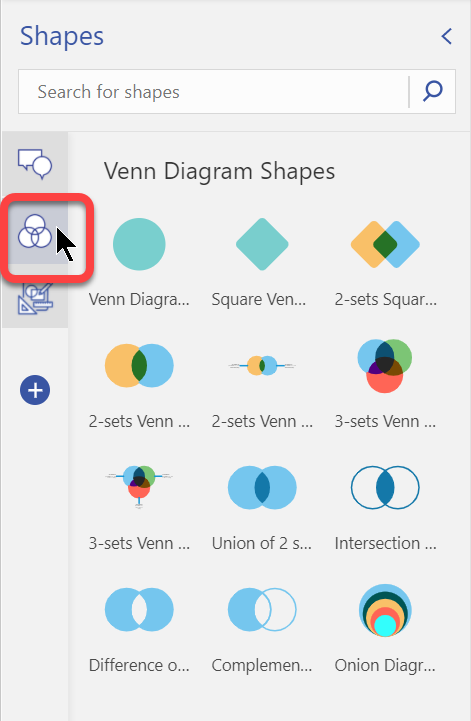
Drag shapes from the Shapes panel onto the canvas:
-
You can change the color of an individual shape segment by right-clicking it and choosing a color from the Fill pop-up menu.
-
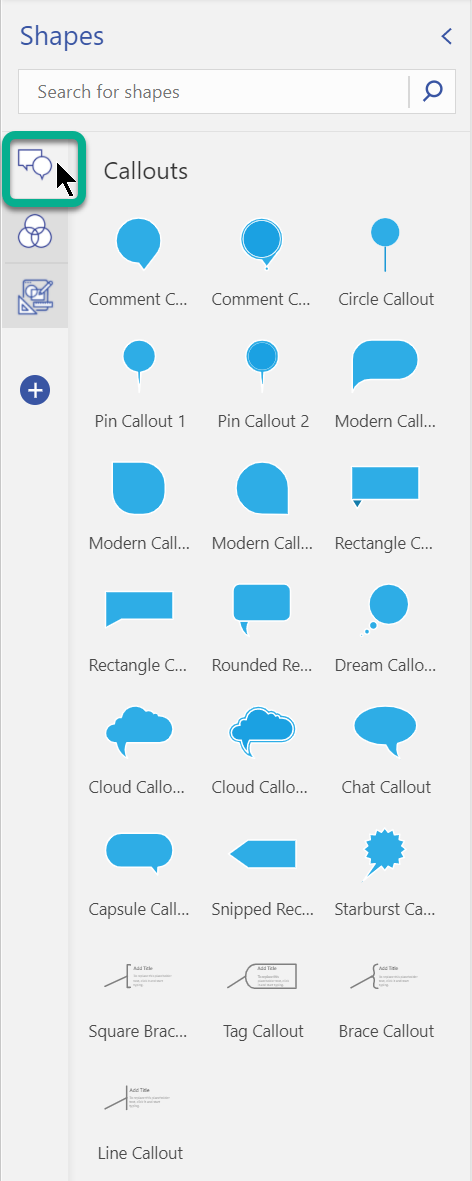
On the Shapes panel, a separate tab of Callouts is available so that you can add callouts to your diagram:
