Note: Microsoft Project for the web will soon become Microsoft Planner. You can continue using most of the Project for the web capabilities in the new Planner once it's rolled out to your organization. Learn more about the new Planner in Frequently asked questions about Planner and Planner help & learning.
You can use the Project Online Power BI Content Pack template to report on the Project for the web data contained in your Dataverse. You can also customize and expand the template's capabilities by changing the file to suit your organization’s needs.
For instructions on connecting to your data sources and installing this template, see Connect to Project for the web data through Power BI desktop.
The template provides connections, or queries, for all the base entities of Project for the web, including Projects, Tasks, Bookable Resources, Project Buckets, Project Team, and System User. It also provides the connections required to retrieve data from the Roadmap service (Roadmap, Roadmap Items, and Roadmap Item Links), and a version is available that includes Project Web App (PWA) connections for complete portfolio reporting scenarios. All template versions are available on GitHub at aka.ms/ProjectReports.
The template provides an example of how Power BI and Project for the web can work together to provide powerful insights into project portfolios.
This template file was created to help you customize your organization's report content and expand insights into different aspects of portfolios. As more functionality is added to Project for the web, the reports will be customized further to offer additional visibility into the data managed by the new features.
It’s often tempting to query for and add all data from a source, with the thought that you might use it in your report later. However, depending on the size of your data set, querying for all data might significantly impact the performance of the report. The more data the report needs to load, the longer the load and refresh can take, and the longer the visualizations may take to render on your screen.
We recommend that you focus on the current reporting needs for your organization or specific reporting scenarios, and optimize your queries to retrieve only the data needed to support your visualizations.
The Project Online Power BI Content Pack template is an example of how to optimize queries for the topic being explored. Some columns that are useful for other topics have been excluded. You can extend the Project entity in the Dataverse in PowerApps by adding more columns. For information on how to do this, see How to create and edit columns. Those columns can be added into the queries to expand or change the focus of the Power BI report.
Example: Exploring location and program columns
-
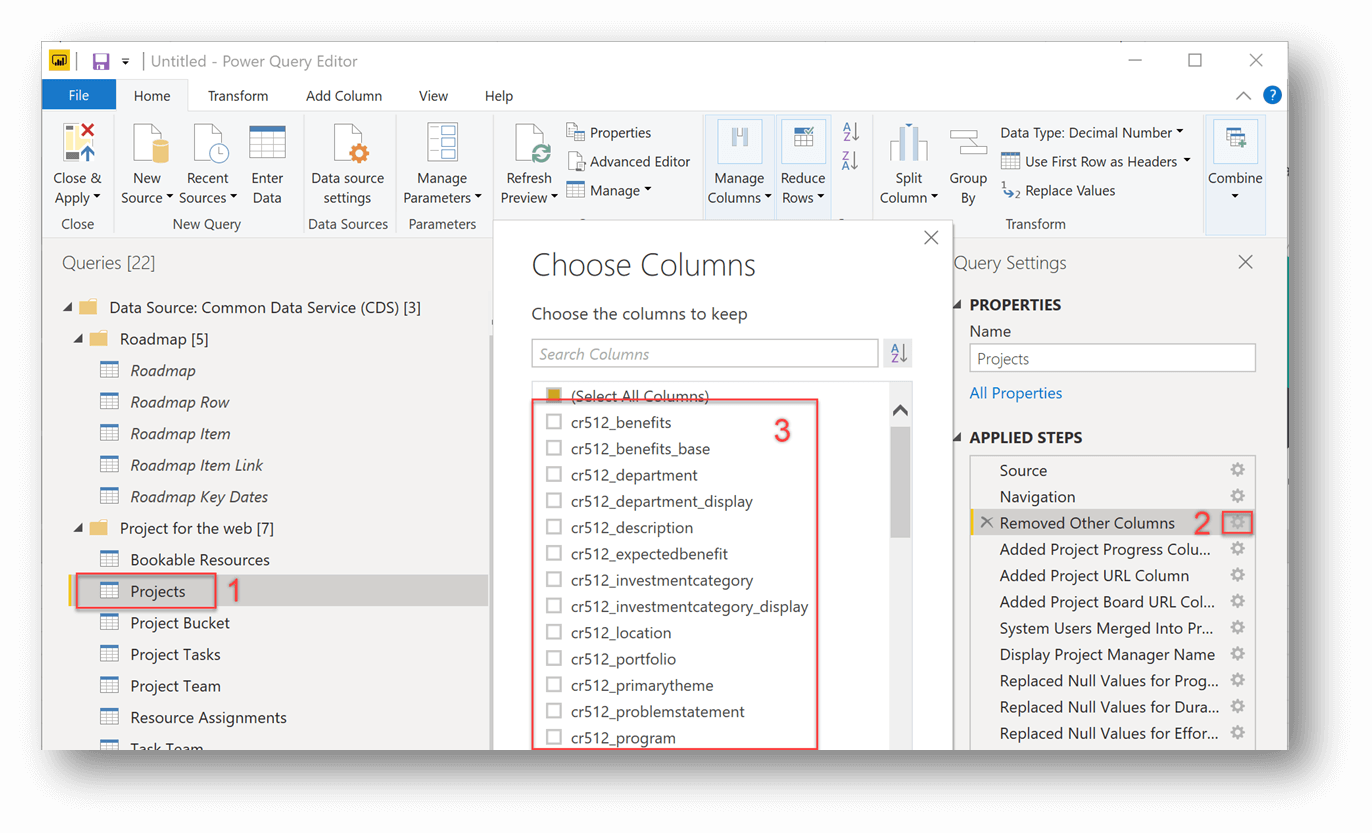
On the ribbon, select Edit Queries, then in the Power Query Editor, under Queries, select Projects.
-
On the right side, under Query Settings, next to Removed Other Columns, select the gear icon.
-
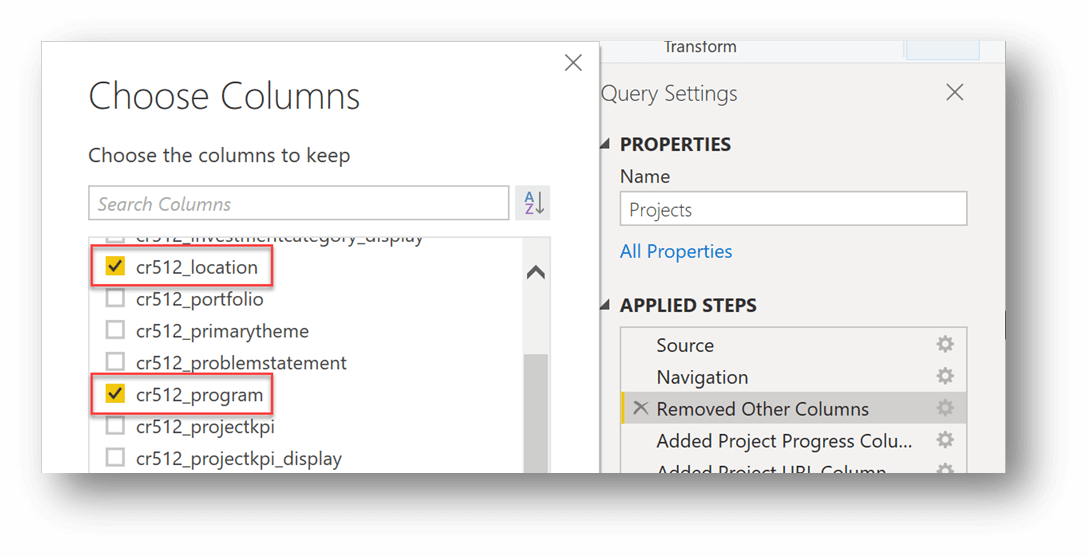
In the Choose Columns dialog box, search for any custom columns that you’d like to add to the report. In this example, we added the cr512_location and cr512_program columns from the list of custom columns the organization had in their Projects entity. You can add custom columns or additional built-in columns.
-
In the Power Query Editor window, select Close & Apply, and then select Refresh on the main Power BI ribbon.
Adding the columns in this example allowed the creation of the following charts that show the project count by program and location.
Another example would be to use the built-in column createdon to show a count of projects created by month.
If you’re developing a report and want to look at additional customized project management artifact data as it relates to the projects in the system, you can add new data tables by querying for custom Dataverse entities. The template design has made it easy to bring in new entities and connect them to Projects in your data model.
-
Select Edit Queries.
-
Under Queries, right-click the Project Bucket query, and then select Duplicate.
-
For the newly duplicated query currently named Project Bucket (shown in the image above), in the Query Settings pane, under APPLIED STEPS, delete the steps for Renamed Columns and Removed Other Columns.
-
Again under APPLIED STEPS, next to Navigation, select the settings gear.
-
Select the entity to which you want to navigate. In our example we’re selecting an entity labeled cr512_issues, which in this example is a custom entity in the Dataverse that stores issue-related data for our projects.
-
Rename your query in the Query Settings pane in the Name box. Here we’ve renamed the query "Issues".
-
To choose the columns you’d like to keep, on the Home tab, select Manage Columns > Choose Columns.
Note: You can also rename your columns to something a little more user friendly (this will help your reports look more professional and improve the Q&A feature in the Power BI Service).
-
In the Power Query Editor window, select Close & Apply.
-
Navigate to your Model view and create relationships as needed with your new entity and the Projects entity.
Note: The relationships you create will depend on your specific scenario. In this example, we have connected the Issues table to the Projects table (Project ID in Projects to cr512_msdyn_project in Issues).
Using the additional data and relationships, you can create a doughnut chart using Projects, Project Name and Issues, Count of cr512_issueid. The chart shows that the two projects with the most issues are the Automated Tracking Sensor project and the Power BI Migration project, each with a count of 4 issues.
Alternatively, the Auto Detect relationships feature can often find new relationships in your data. On the ribbon of the main Power BI screen, select Manage Relationships, and then select the Auto Detect button at the bottom. Power BI will discover the new data relationships in the report. When complete, it will display how many new relationships it found now that new data and columns have been added. You’ll want to review these new relationships to ensure that the resulting data model is what you expect.
As you add more connections (queries) to the report, you may choose to allow the Power BI service to provide you with insights from your dataset.
-
For a summary of how Power BI Insights can be used, please see Generate data insights on your dataset automatically with Power BI.
Additionally, pinning visualizations to a dashboard can lead to using Q&A in the Power BI service to get additional insights from the dataset.
-
For details on dashboard development, see Create a Power BI dashboard from a report.
-
For additional information on Q&A, see Use Power BI Q&A to explore your data and create visuals.
-
For instructions on how to add visualizations (like charts and maps) to reports, see Add visualizations to a Power BI report (part 1) and Add visualizations to a Power BI report (part 2).


