
Event organizers in Viva Engage can now get insights to measure the reach and engagement of their live events. This data can help organizers plan and deliver more powerful events.
Who can see live events insights in Viva Engage?
Live Events Insights are available to organizers and producers of the Live Event.
How do you see live events insights?
Note: Live Events Insights are only available for Live Events started after January 1, 2021.
-
In a browser, go to Viva Engage and navigate to a community.
-
Click on Events and choose an upcoming or past event, and then select View.
-
Look for the Organizer Insights dashboard, which contains information about your event.
Understanding organizer insights
This section shows information on conversations, views, and people in the live event. Clicking on See All expands the Reach and Engagement sections of Live Event Insights.
-
Before and after the event: Shows the total number of conversations and times people viewed this live event, including multiple views by the same person.
-
During the event: Shows the total number of conversations and number of people watching the event live.
Reach and Engagement Insights
Live Events Insights are split into two sections – Reach and Engagement.
Reach
The Reach section contains insights about users attending your events – before, during and after the event is completed.
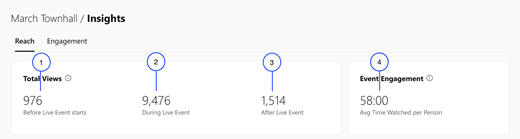
1. Before Live Event Starts: Shows the total number times users viewed your Live Event by visiting the Live Event page before the event started.
2. During Live Event: Shows the total number times users viewed your Live Event by visiting the Live Event page while the event was running live.
3. After Live Event Ends: Shows the total number times users viewed your Live Event by visiting the Live Events page after the event ended.
4. Average time watched per person: Shows the average time that users spent watching your Live Event, while the event was running live.
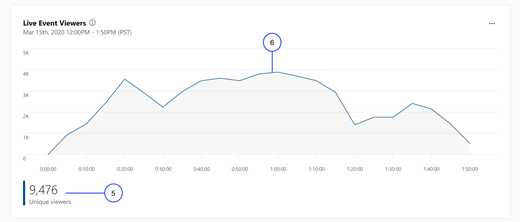
5. Unique Viewers: Shows the total number of unique users who viewed your Viva Engage Live Event while the event was running live.
6. Unique Viewers line graph: Shows the number of unique users viewing the event when the event was running live.
Engagement
The Engagement section is about activity that people perform in your event – such as asking and answering questions and reacting to conversations.
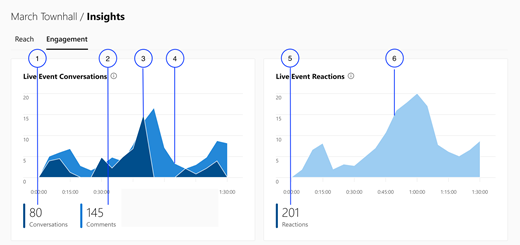
1. Conversations: Shows the total number of conversations generated during the live event when it was running live. The Conversations count includes Discussions and Questions.
2. Comments: Shows the total number of comments or answers that users posted to Questions and Discussions while the event was running live.
3. Conversations graph: Plots the number of conversations generated by users during the event on a graph.
4. Comments graph: Plots the number of comments generated by users during the event on a graph.
5. Reactions: Shows the total number of reactions generated during the live event when it was running live. Reactions are cumulative of all reaction types – Like, Love, Laugh, Celebrate, Thank, and Sad.
6. Reactions graph: Plots the number of reactions generated by users during the event on a graph.
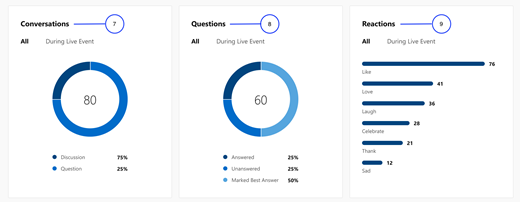
7. Discussions and Questions: Shows the total number of Conversations split by Discussions and Questions.
8. Questions: Shows the total number of questions split by whether the question was Answered, Unanswered or has been marked Best Answer.
9. Reactions: Shows the total number of Reactions split by the reaction type chosen by users – Like, Love, Laugh, Celebrate, Thank, and Sad.
10. Top Conversations: Shows top conversations sorted by the highest number of reactions in your event.
11. Questions without Best Answers: Shows questions that have no Best Answers.
FAQ
Q: How often are the insights updated?
A: The organizer insights dashboard is updated in real-time, before, during and after the event. The Reach and Engagement sections increment every 5 minutes.
Q: Can community managers see Live Events insights?
A: Currently the insights are only available to event organizers and producers. Adding permissions for Community Managers to view insights is being considered for future versions.


