Looking for a little help creating a Gantt Chart? Use the Gantt Chart Wizard to end up with the chart you want.
Before you start, you’ll need to add the Gantt Chart Wizard to the Project ribbon.
-
Select File > Options > Customize Ribbon.
-
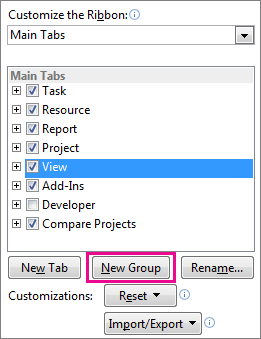
In the right column, select the tab you want to add the Gantt Chart Wizard to (for example, View), and then select New Group.
-
To give your new group a name (for example, Wizards), select New Group (Custom), select Rename, type your new name, and then select OK.
-
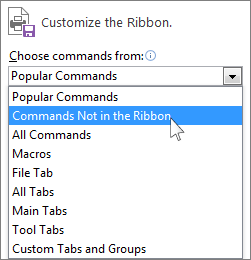
In the left column, select the arrow under the Choose commands from drop-down menu, and then select Commands Not in the Ribbon.
-
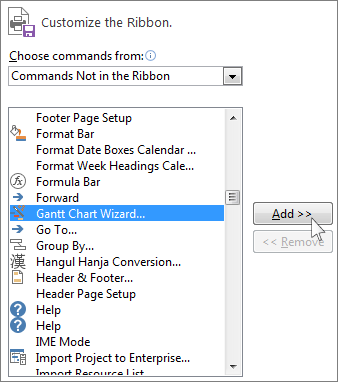
Find and select Gantt Chart Wizard from the list, and then highlight the new group you created in step 2 (it’s in the right column). Select Add, and then select OK.
-
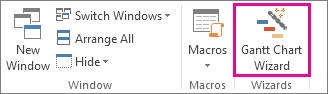
Select the tab where you put the wizard (in this example, we used the View tab), and then select Gantt Chart Wizard. Follow the steps to create your new chart.