
Note: This article has done its job, and will be retiring soon. To prevent "Page not found" woes, we're removing links we know about. If you've created links to this page, please remove them, and together we'll keep the web connected.
To create a chart in Word or PowerPoint, you must have Excel installed.
-
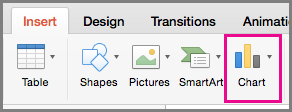
On the Insert tab, click Chart.
-
Select the type of chart you want, like column or pie chart.
-
Enter your data into the Excel spreadsheet that automatically opens with the chart. The chart will update to match the data after you finish typing in one cell and move to the next.
Note: You can edit your data in Excel, and you do not need to save the Excel file for your changes to be applied to your chart in Word or PowerPoint.
-
You can edit your data at any time by clicking your chart, and then clicking Edit Data in Excel on the Chart Design tab.


