
Visio is a diagraming tool that makes it easy and intuitive to create flowcharts, diagrams, org charts, floor plans, engineering designs, and more by using modern templates with the familiar Office experience. On this page, you can access some of the top templates and sample diagrams available in Visio, or request ones that you want.
To see the hundreds of templates and sample diagrams available, you can open a template in the Visio app or in Visio for the web.
Note: Don't have Visio yet? Compare plans and pricing or sign up for a Visio trial.
Click a category name to see the related templates and diagrams:
General
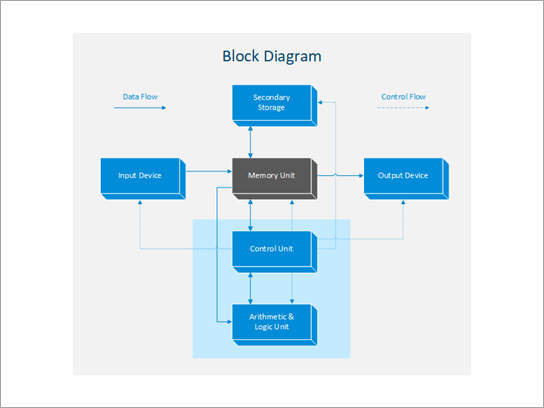


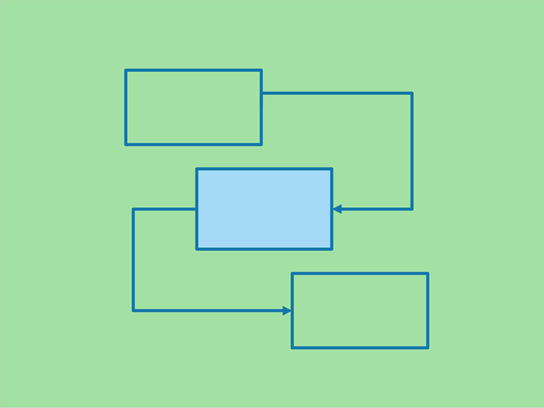
A block diagram template for a block diagram of a computer.
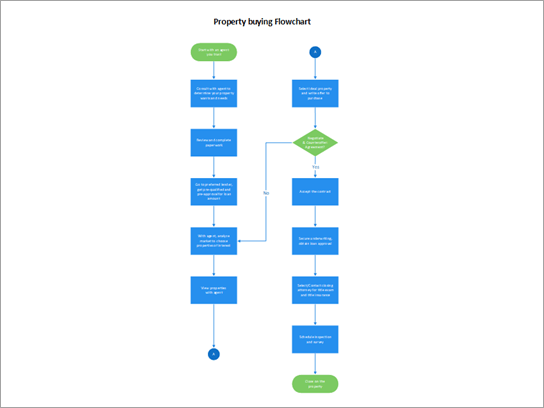
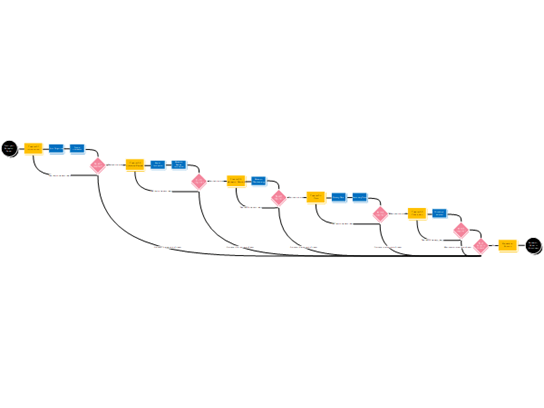
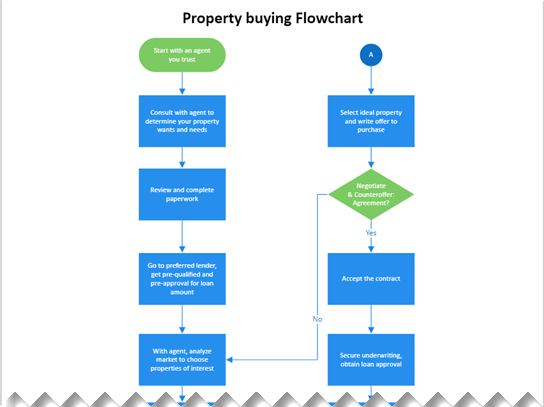
A flowchart diagram that details the steps for buying a property.
Flowcharts

A vertical flowchart best used for top-down processes or systems that involve hierarchies, or have many component processes.
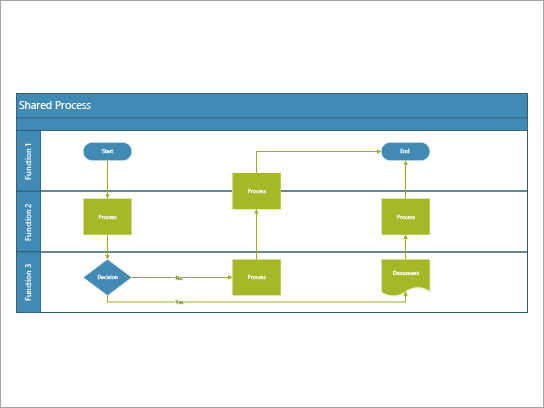
A cross-functional flowchart best used for a process that includes tasks shared across roles or functions.
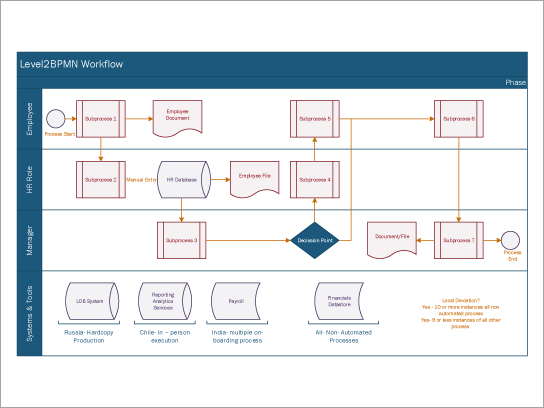

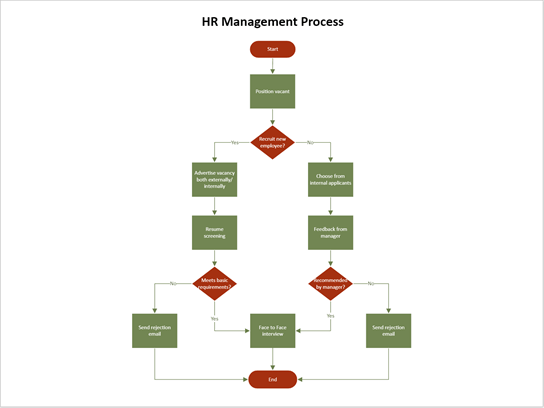
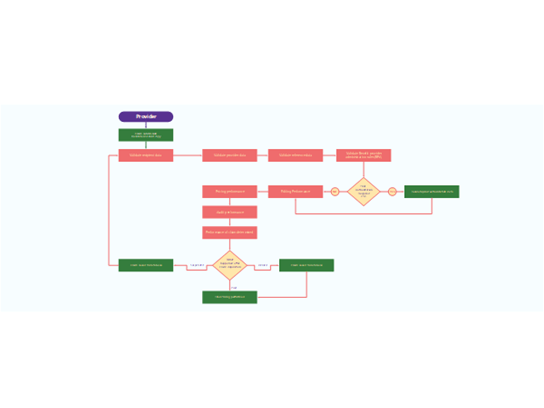
Show the relationship between a process and the organizational or functional units in a HR Process flow. This is a Level 2 BPMN Workflow.
Networks
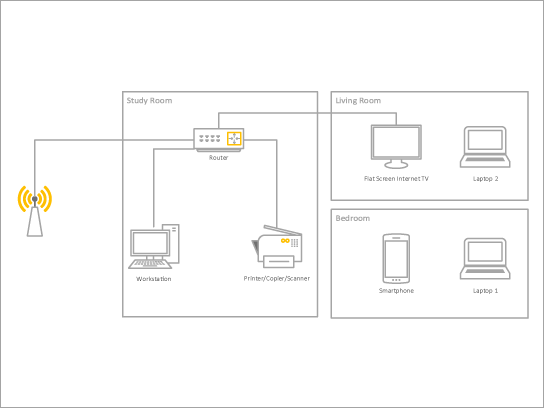
Best used to design a home network with wired and wireless devices in different rooms.
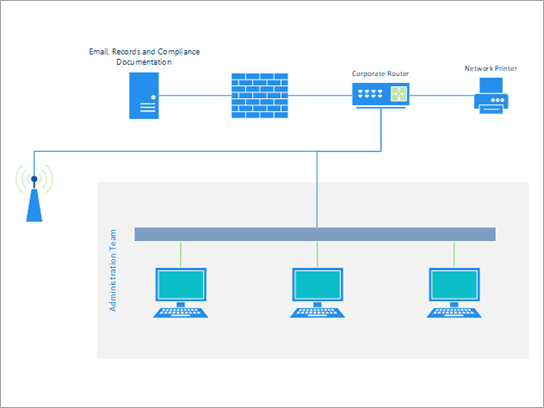
A basic network template for a small office or team's network diagram.

A detailed network topology for a star network diagram.
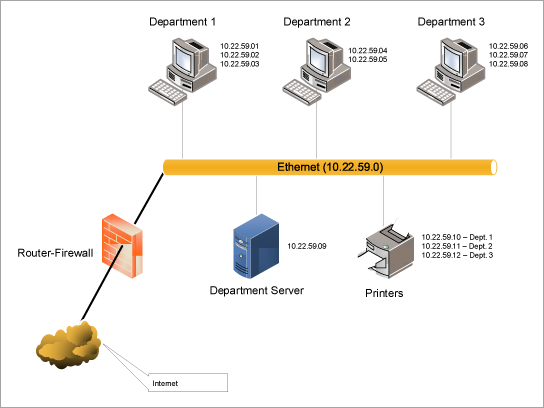
A detailed network diagram best used to show a corporate network for a medium-sized enterprise.
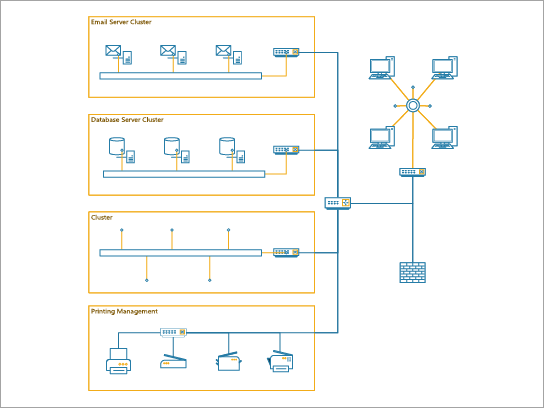
Create detailed physical, logical, and network architecture diagrams using a comprehensive set of network and computer equipment shapes.
Floor plans
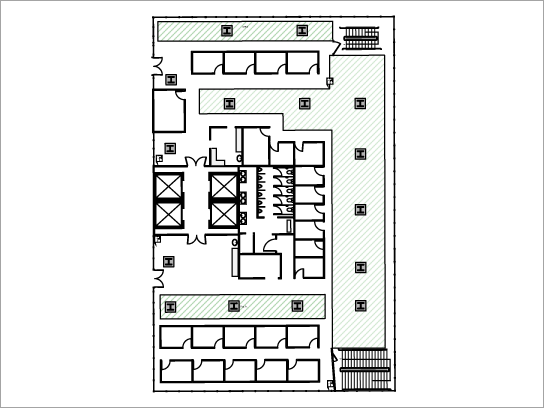
Use this template to create detailed and accurate floor and building plans.
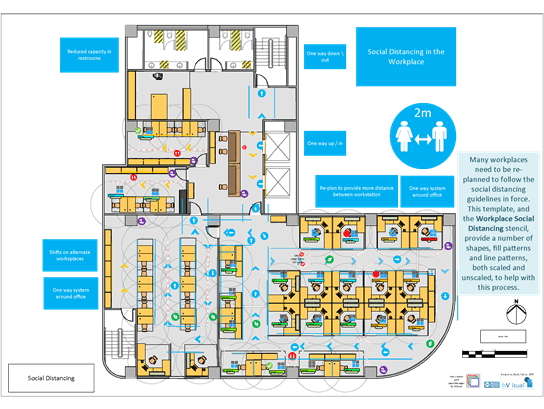
Floor plan with social distancing features (U.S.)
Floor plan with social distancing features (Metric)
Software and database
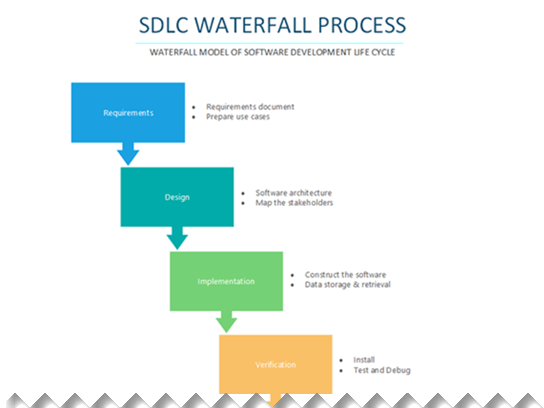
A process diagram for a waterfall process model of a software development life cycle.
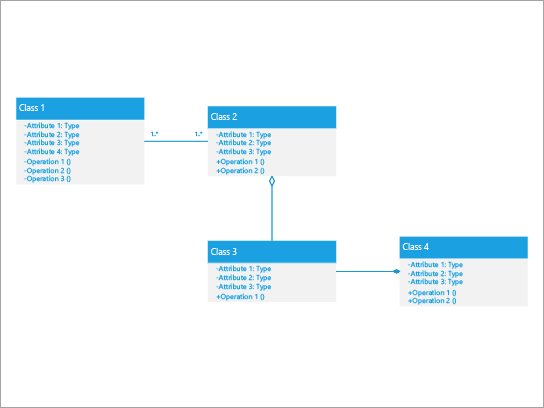
UML class diagram best used to show a system in which a class has composition and aggregation relationships
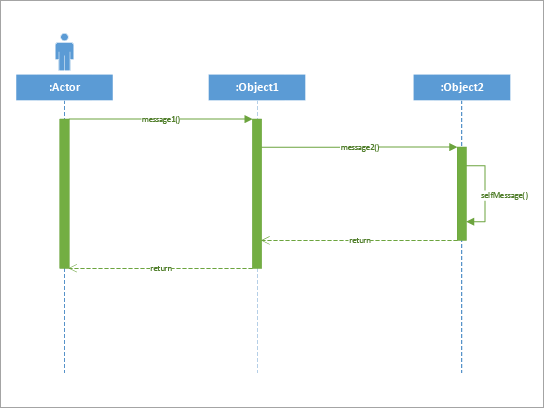
A basic UML sequence diagram best used to show how parts of a simple system interact with each other
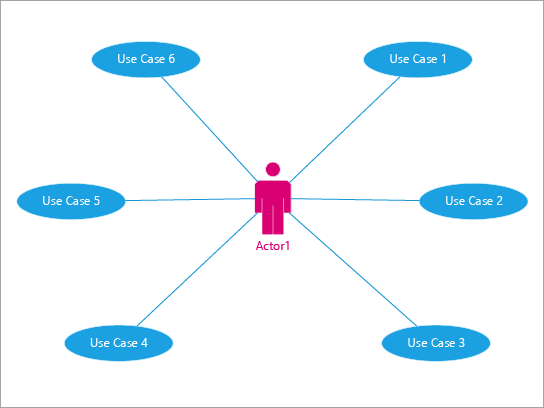
A basic UML use case diagram best used to show a user's interactions with events and processes.
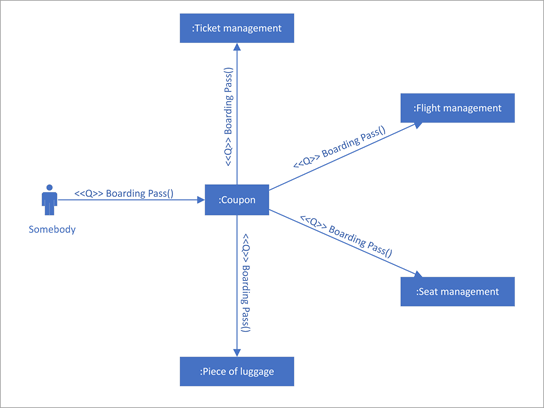
UML communication diagram that shows the interactions between lifelines that use sequenced messages.
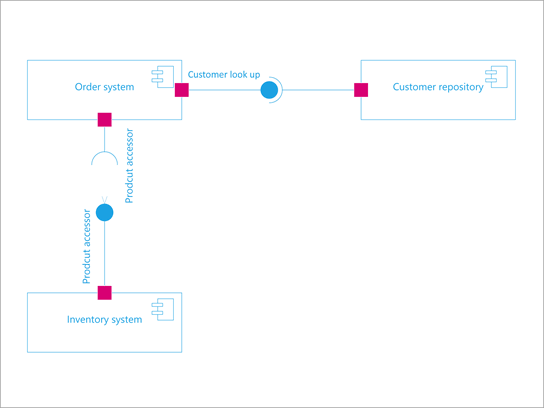
UML component diagram to show components, ports, interfaces and the relationships between them
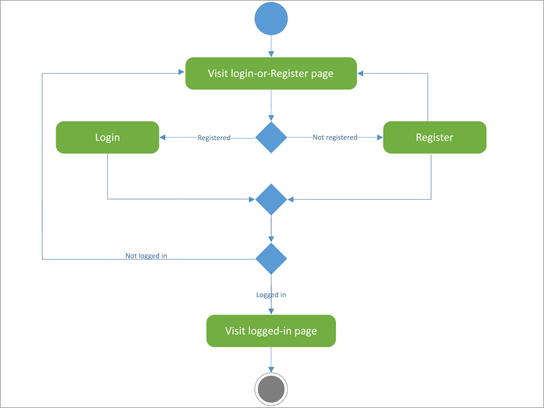
Use this UML diagram to show login-registry activity.
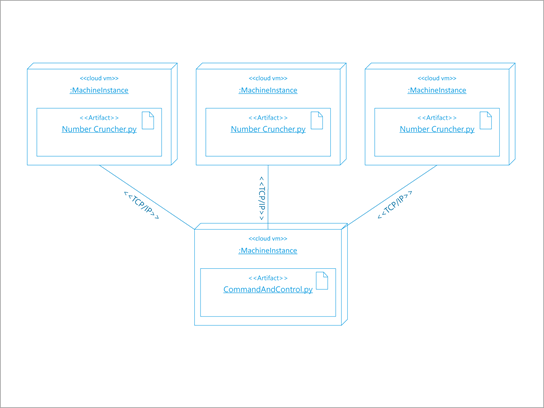
Use this diagram to show the architecture of a software deployment.
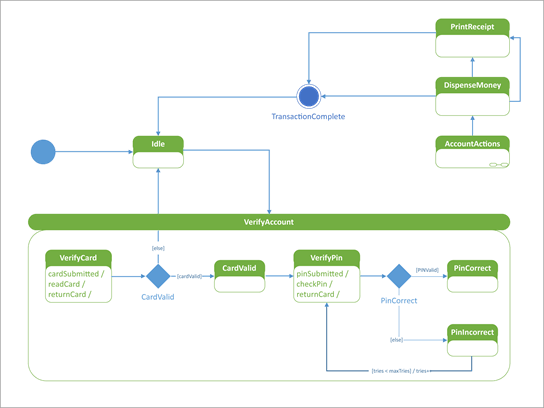
Use this diagram to design a state diagram that shows how an automated teller machine responds to a user.
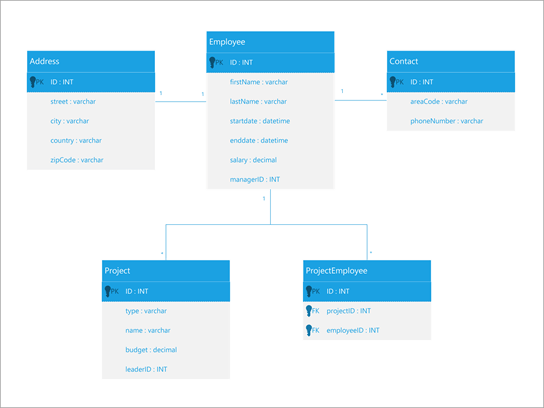
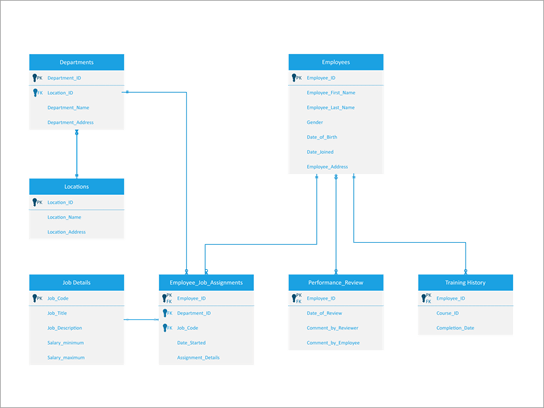
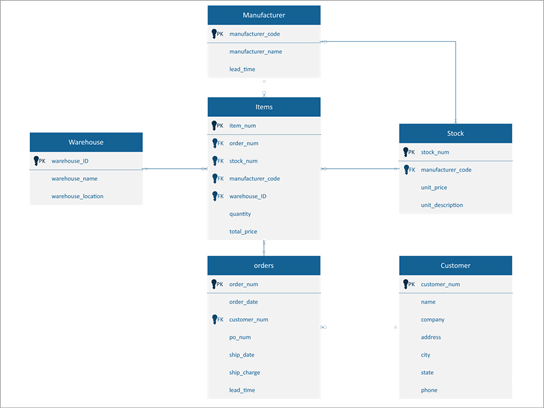
Use this diagram to design an employee database for an organization.
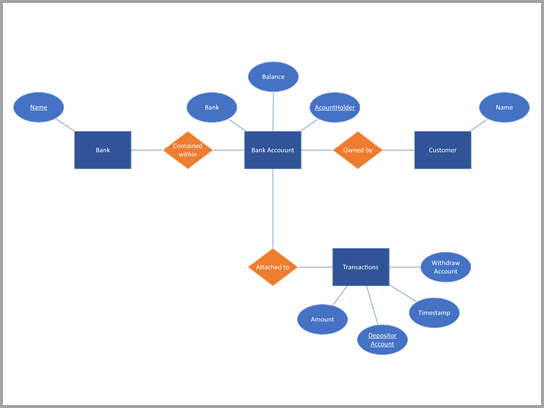
Chen's database diagram of a bank account
Azure
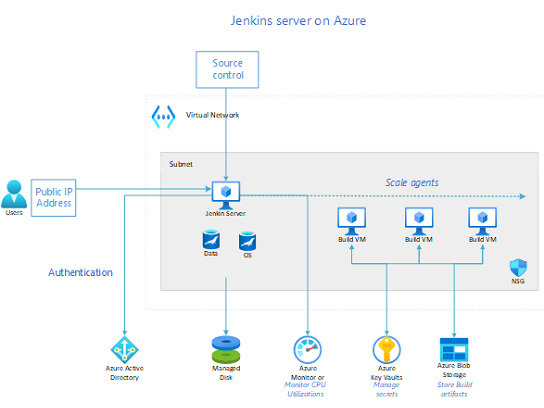
Jenkins Server on Azure

Integrating On-premises Active Directory domains with Azure AD
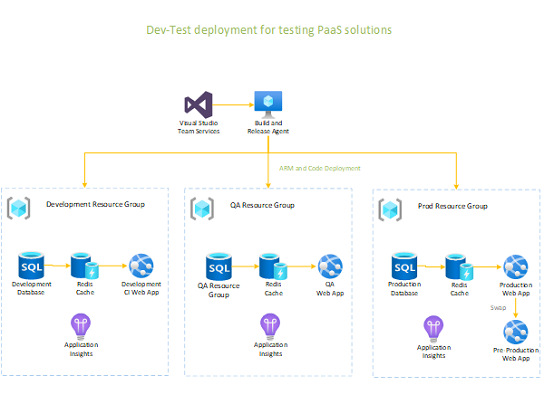
A dev-test deployment for testing PaaS solutions
AWS
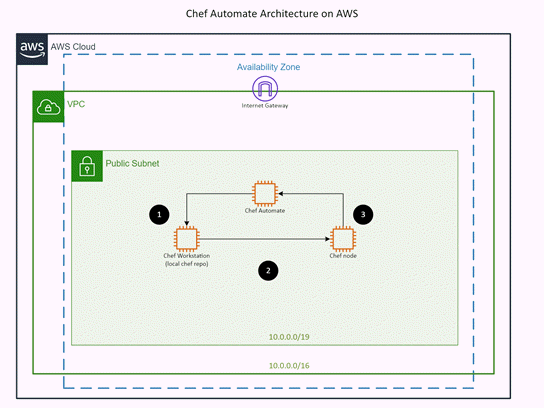
AWS template: Chef Automate Architecture
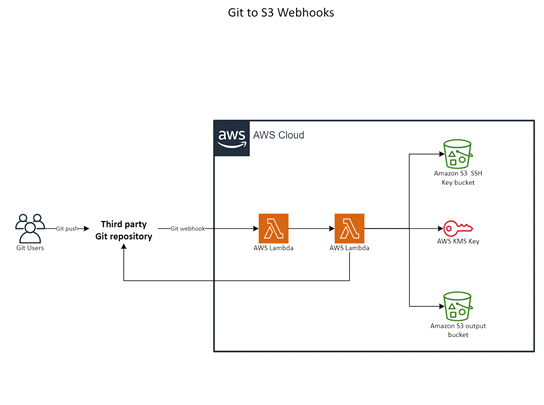
AWS template: Git to S3 Webhooks
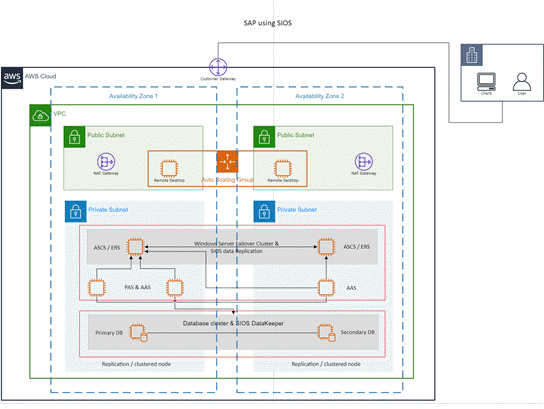
AWS template: SAP using SIOS
Schedules
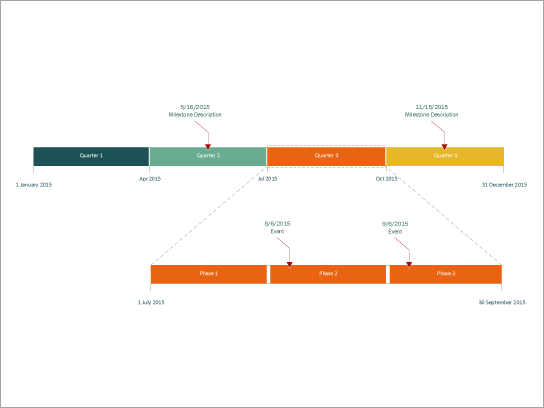
Best used to track milestones, events, tasks, and phases over a period of time. Also used to create Product Roadmaps.
Business
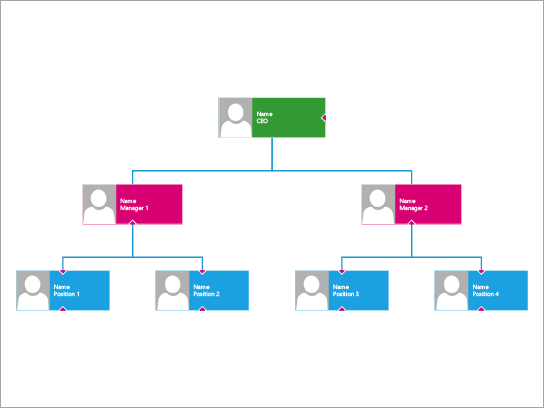
Organizational chart best used to show hierarchy levels and reporting relationships, in an attractive, modern format.
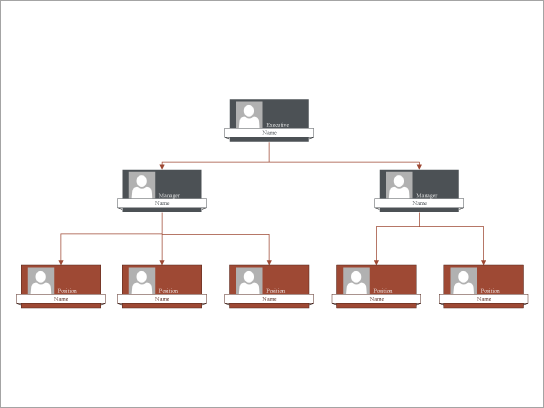
Create an organization chart with a multi-level hierarchy. Try different layouts that fit your diagram into a printable space.
A basic auditing diagram best used for a simple process that must satisfy a decision point to complete.
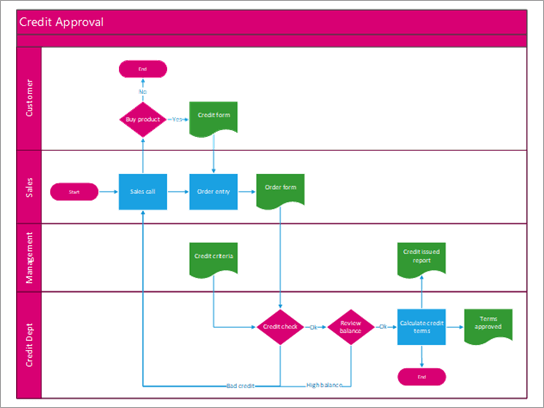
A cross-functional flowchart for a credit approval process.
Crow's foot diagram of a Human Resources management system.
Crow's foot diagram of an Inventory management system.
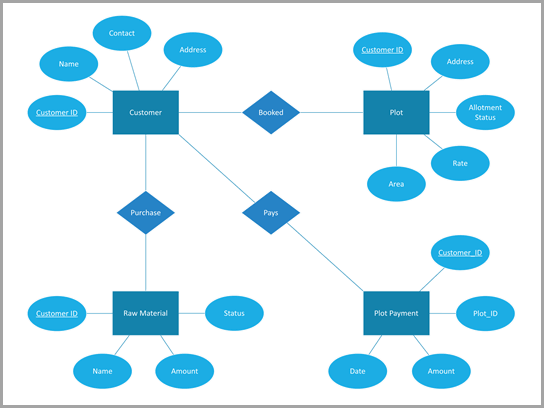
Chen's diagram of a Construction management organization.
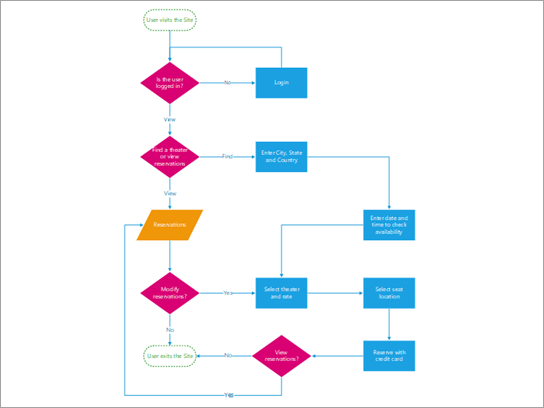
This flowchart template shows the steps for purchasing theater tickets from an online service and how different actions affect the user's Web experience.
A diagram template that can be used to create marketing strategies that influence customers to purchase a company's products.
Engineering
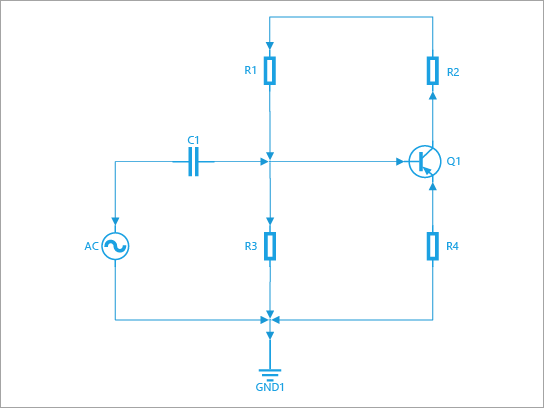
A basic engineering electrical diagram best used to draw an electronic circuit that can include semiconductor devices.
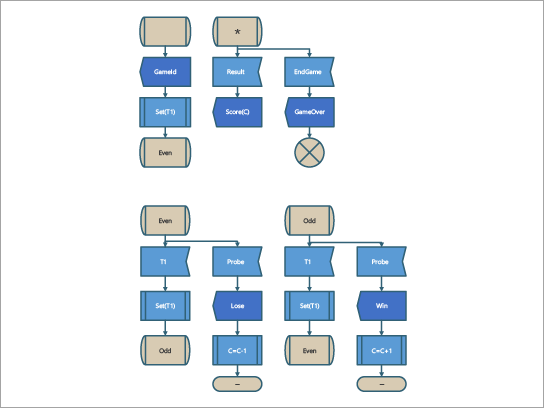
A Specification and Description Language diagram template for an SDL game process.
See Also
This page lists all the templates and sample diagrams available with Visio in Microsoft 365. For each category, there is a button you can click that opens the template or sample with its stencils and shapes—right in Visio so that you can get started trying it out.
Click a category name to go to a list of related templates and samples:
Basic diagrams

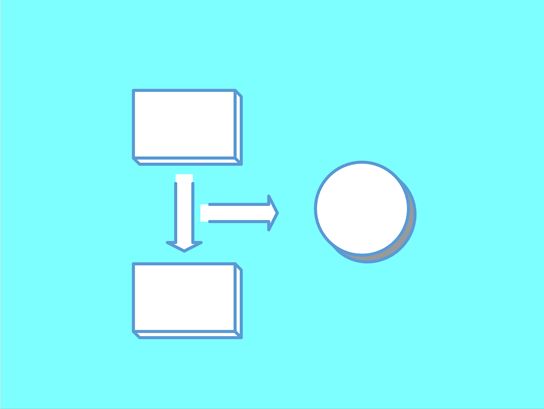
Contains basic geometric shapes, arrow shapes, decorative and graph shapes for making a general diagram.
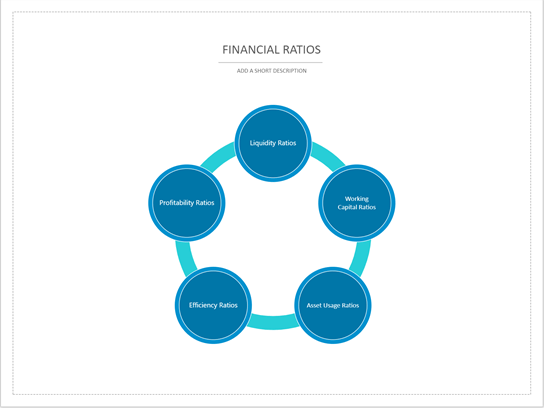
Looks at five elements: liquidity, working capital, asset usage, efficiency, and profitability ratios.
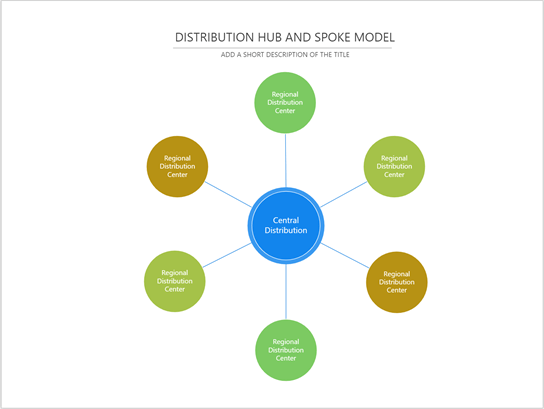
Illustrates the distribution model based on a hub with supporting regional distribution nodes.
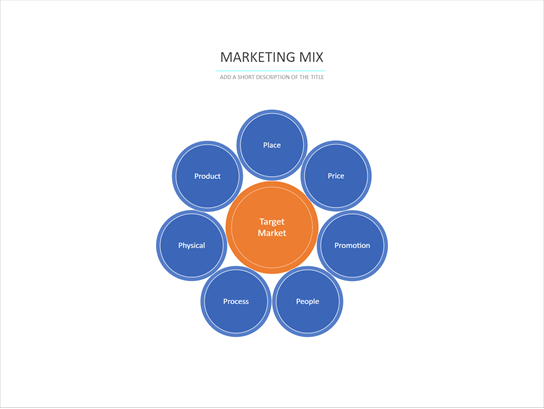
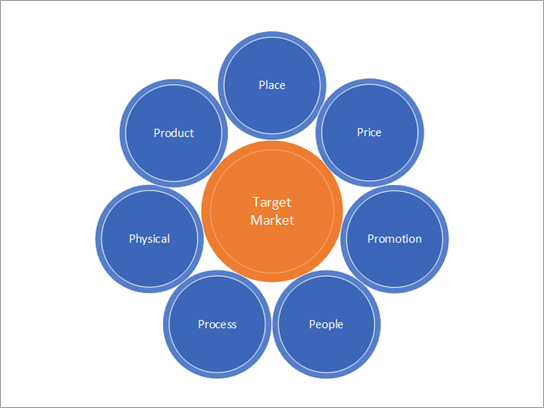
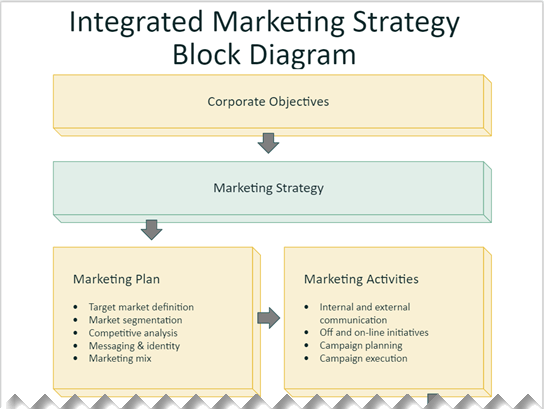
Illustrates multiple aspects of a marketing program centered on the target market.
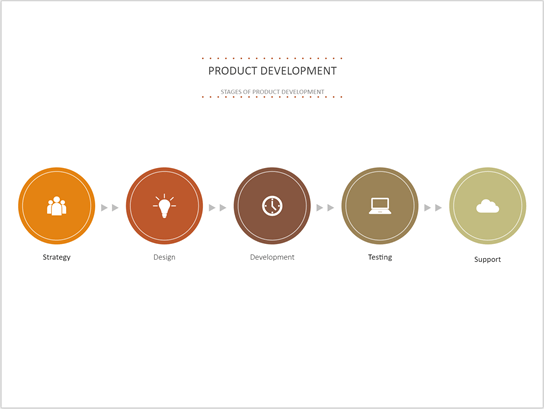
Illustrates a five-phase model of development: strategy, design, development, testing, and support.
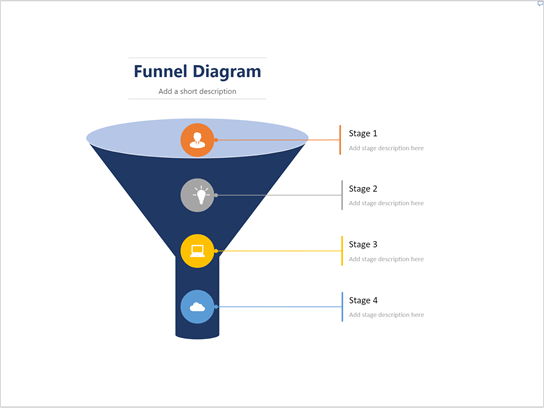
Funnel diagram illustrated with icons and callouts.
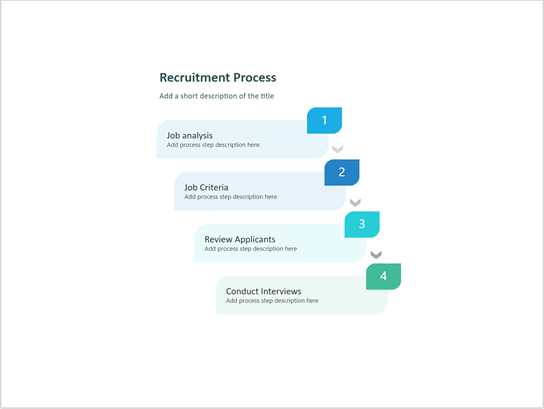
Illustrates four steps in an organization's recruitment process for a job opening.
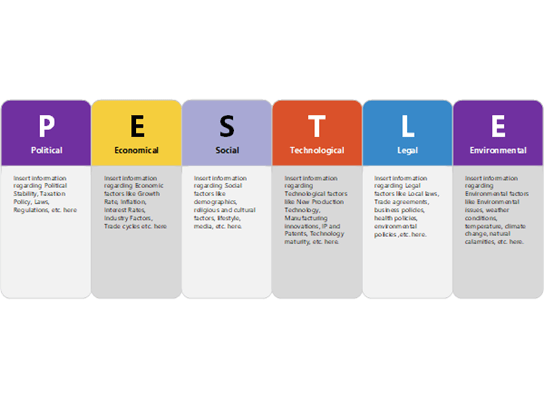
Analyze a business or an industry on six factors: political, economic, social, technological, legal, and environmental.
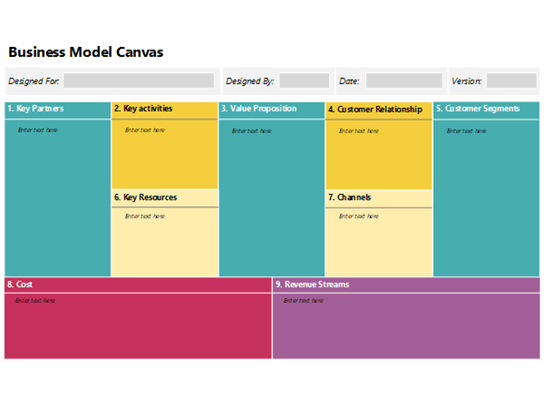
Map out the nine major components of your business. This canvas gives a bird’s eye view of your entire business and is useful for strategizing.
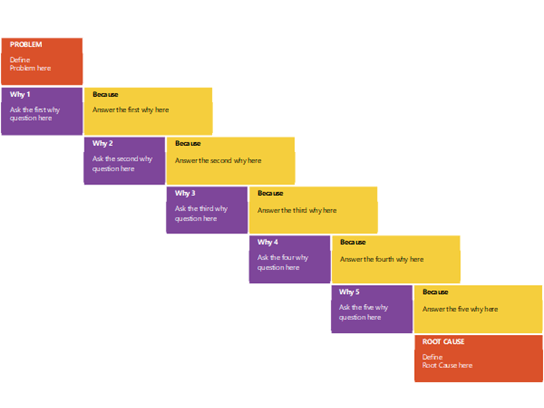
"Five why's analysis" is an iterative technique for root-cause analysis.
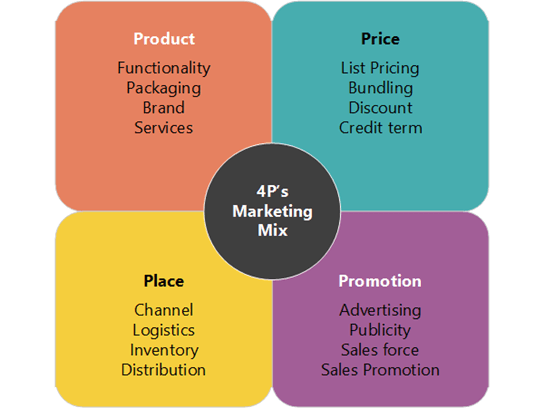
Convey a marketing strategy by identifying four essential factors that are necessary for marketing the good or service.
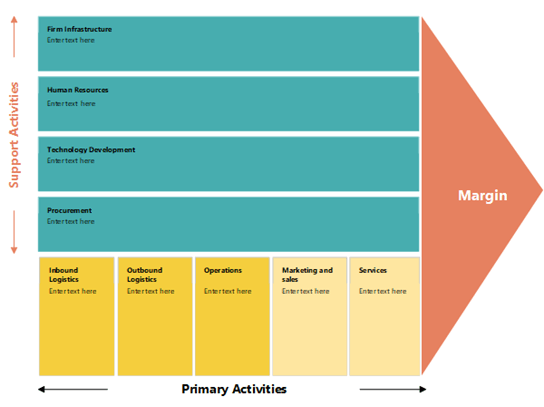
Visualize all activities that a company undertakes to deliver a good or service to market.
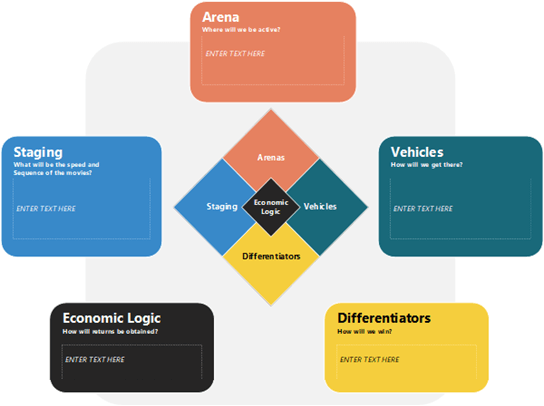
Concisely illustrates an organization’s overall strategy, highlighting five key components. It can be used as a checklist for a healthy strategy.
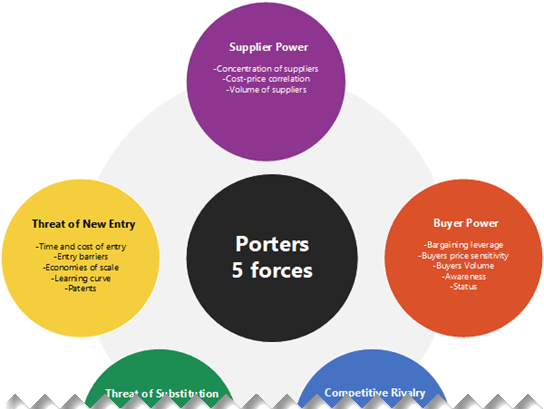
Analyze an industry’s attractiveness, or evaluate a company’s competitive environment.
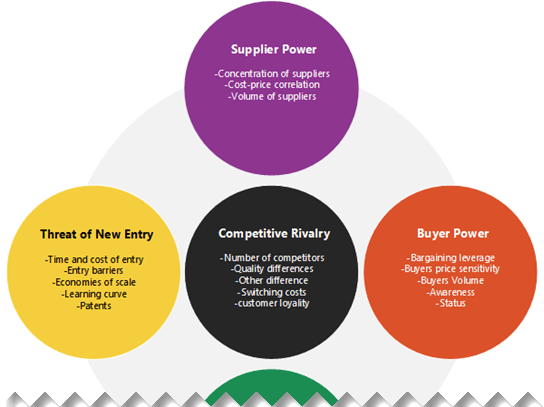
Analyze an industry’s attractiveness or evaluate a company’s competitive environment.
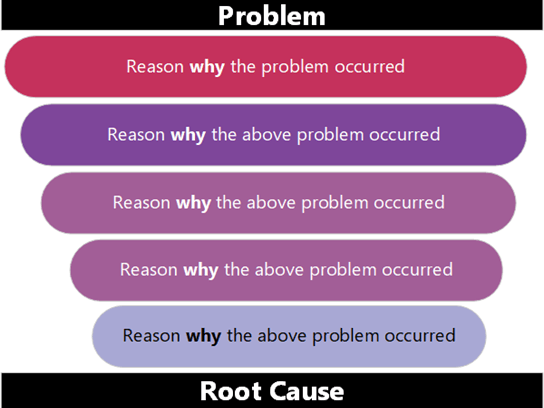
"Five why's analysis" is an iterative technique for root-cause analysis.

"Five why's analysis" is an iterative technique for root-cause analysis.
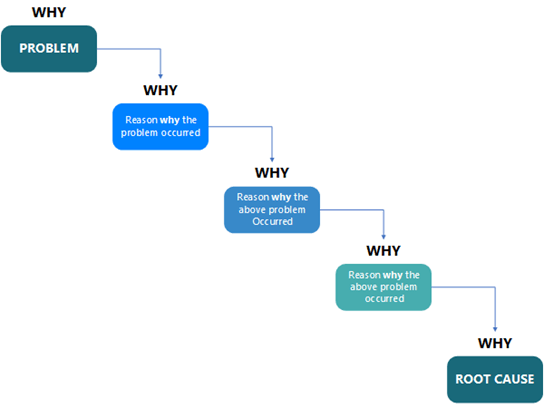
"Five why's analysis" is an iterative technique for root-cause analysis.
Block diagrams
Contains 2-D and 3-D shapes and directional lines for feedback loops and annotated functional decomposition, data structure, hierarchical, signal flow, and data flow block diagrams.
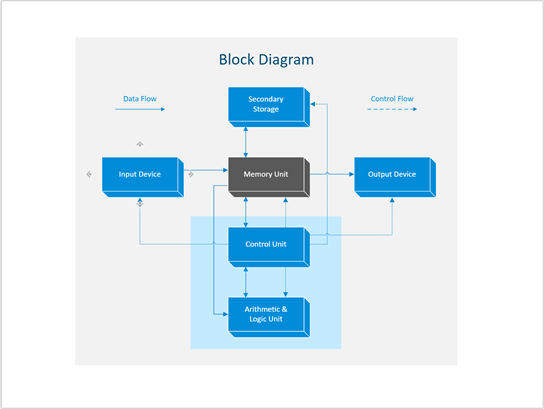
This diagram can be used to illustrate elements of a computer system.
Manage your content through multiple stages.
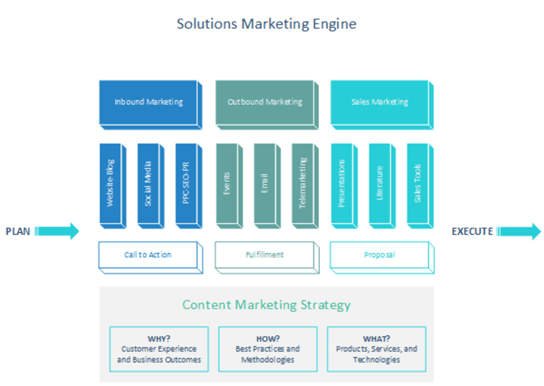
Helps align and coordinate marketing channels and assets in a coherent strategy.
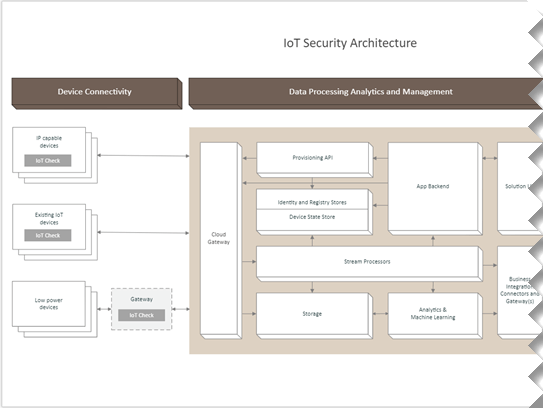
Layers of security analysis.
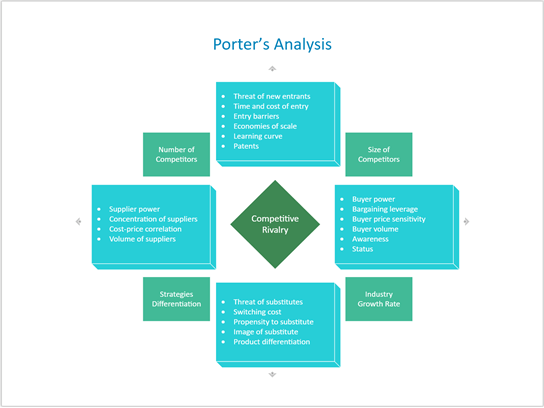
Identifies an industry's structure to determine a corporate strategy.
Blocks and connectors show the process of writing a research paper.
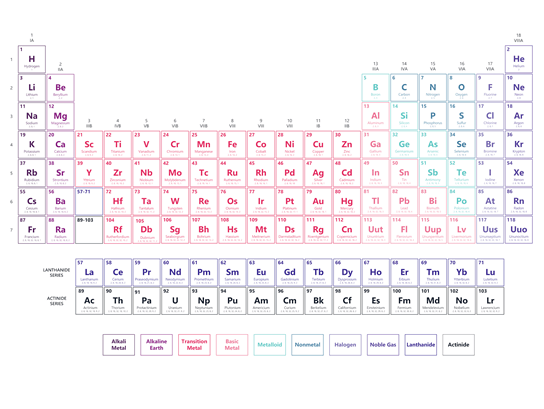
Color-coded 3D blocks represent elements from the modern periodic table.
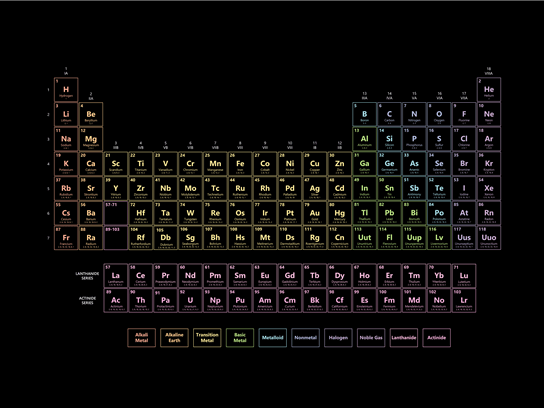
Color-coded 3D blocks represent elements from the modern periodic table.
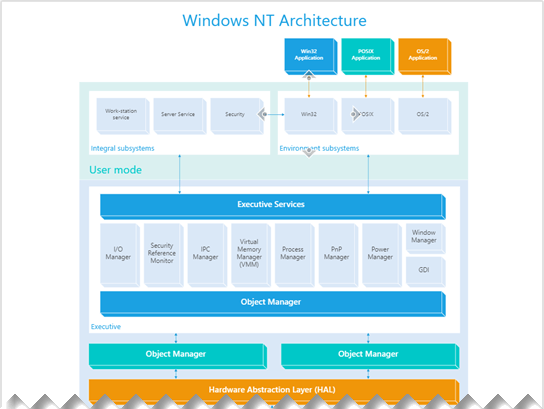
Illustrates all layers in the Windows NT architecture.
Business Matrix
Contains business matrix diagrams that shows relationships between concepts across two or more dimensions. Create 2x2, 3x3 matrix, SWOT analysis, Ansoff matrix, BCG matrix, position maps, Quadrant analysis diagrams, or illustrate concepts across axes.
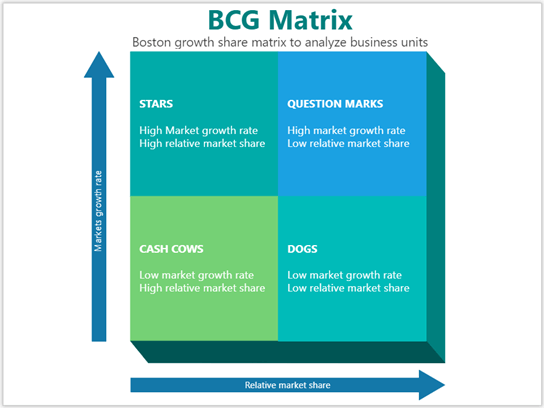
Contains a growth-share matrix to help an organization analyze its business units. Also known as "product portfolio matrix".
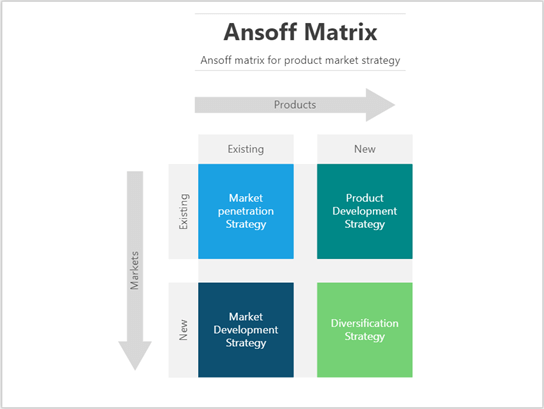
Contains a marketing planning tool which usually aids a business in determining its product and market growth.
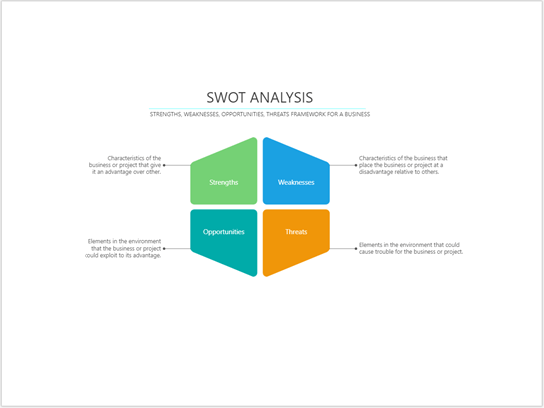
One of four sample diagrams that allows a business to undertake an analysis to identify its internal strengths and weaknesses, as well as its external opportunities and threats.
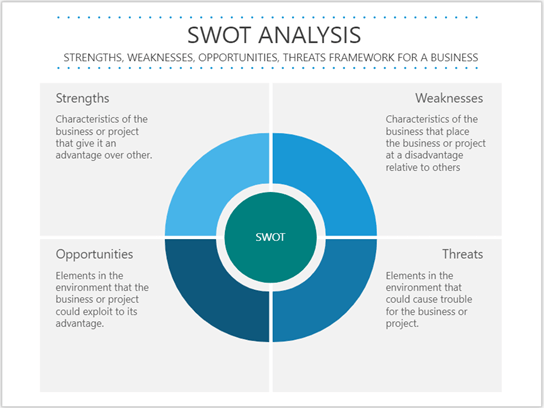
The second of four sample diagrams that allows a business to undertake an analysis to identify its internal strengths and weaknesses, as well as its external opportunities and threats.
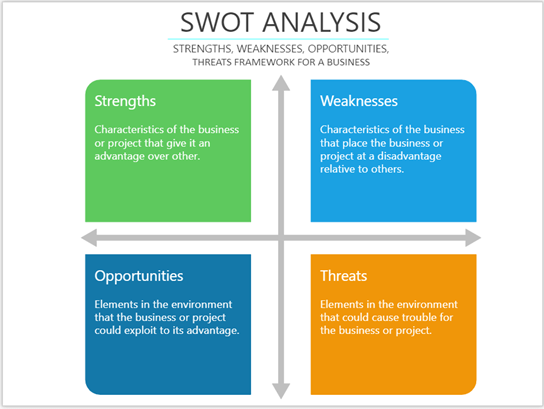
The third of four sample diagrams that allows a business to undertake an analysis to identify its internal strengths and weaknesses, as well as its external opportunities and threats.
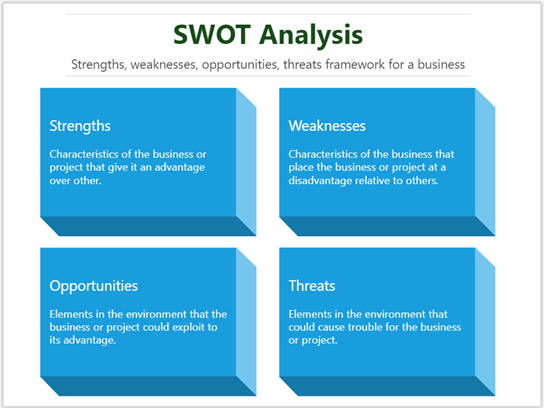
The fourth of four sample diagrams that allows a business to undertake an analysis to identify its internal strengths and weaknesses, as well as its external opportunities and threats.
Cycle diagrams
Represents a sequence of stages, tasks, or events in a circular flow. Contains circular, radial, target, circular segments, pie segments, loops and other cyclic diagram shapes.
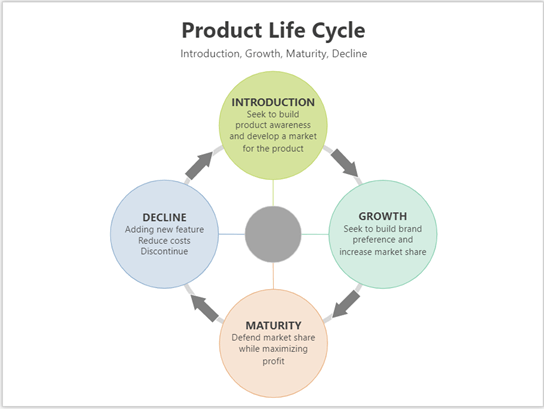
Covers four stages in the product life cycle: introduction, growth, maturity, and decline.
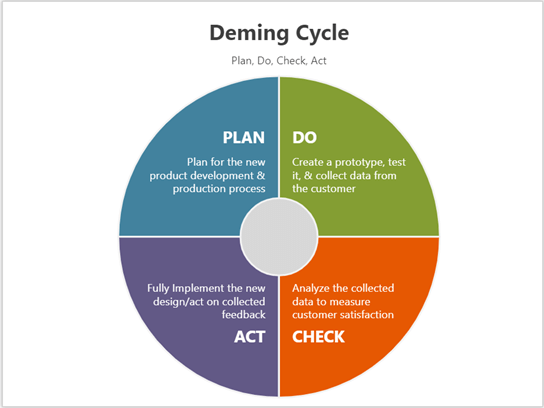
The Deming Cycle is a model for continuous improvement of quality in four stages.
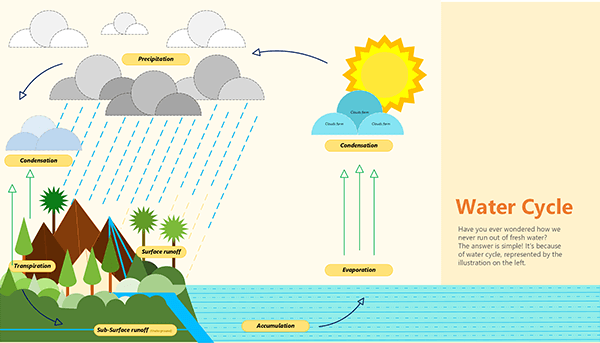
Shows the continuous circulation of water in the Earth-atmosphere system.
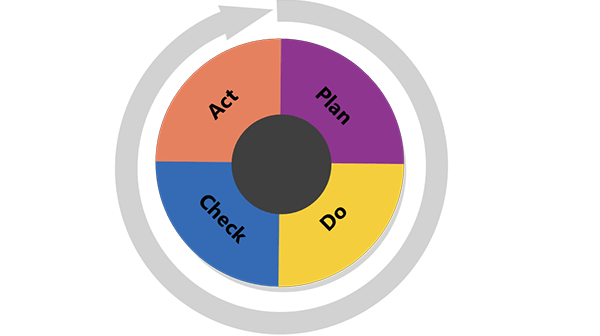
An interactive problem-solving strategy for improving processes and implementing change.
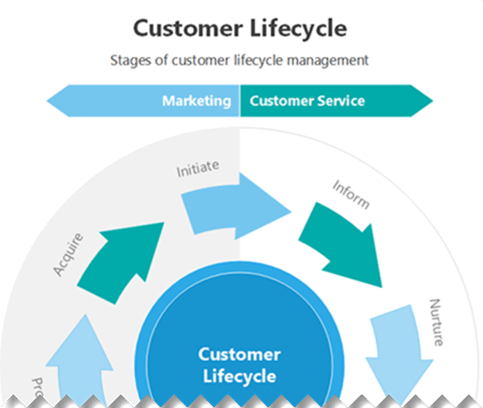
Illustrates the stages of customer lifecycle management.
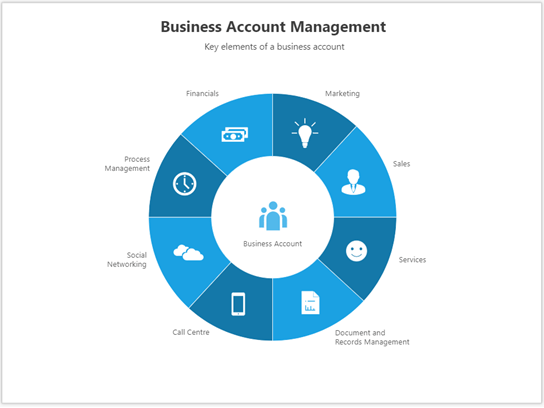
Illustrates eight key elements of a business account.
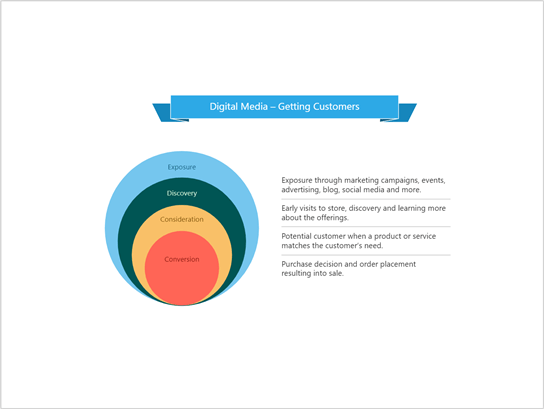
Stages of customer acquisition—from communication to conversion.
Flowcharts
Create flowcharts, top-down diagrams, information tracking diagrams, process planning diagrams, and structure prediction diagrams. Contains connectors and links.
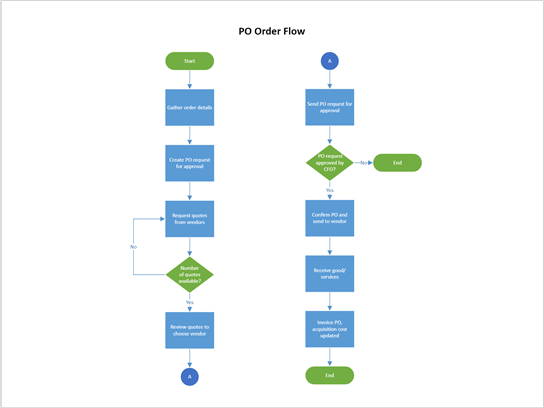
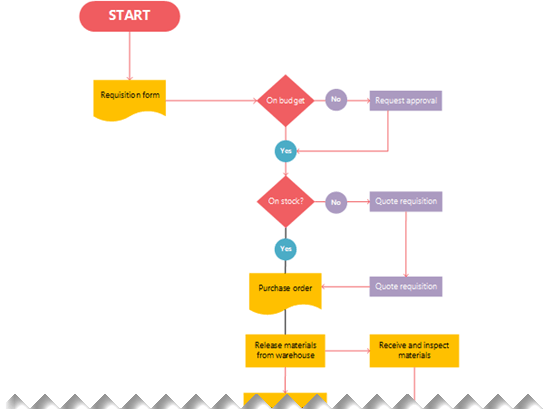
Demonstrates a purchase-order flow for a product.
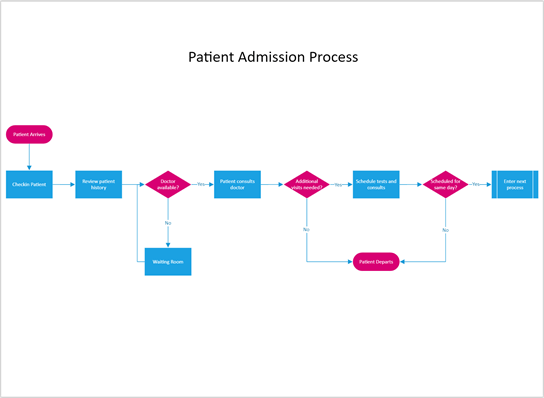
Flowchart illustrating the process of admitting a person for medical care.
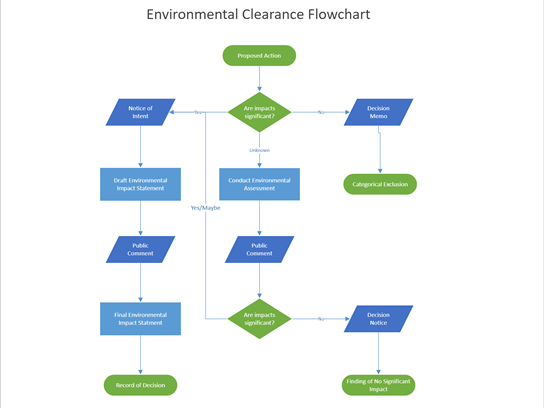
Flowchart illustrating the evaluation process for mitigating an environmental issue.
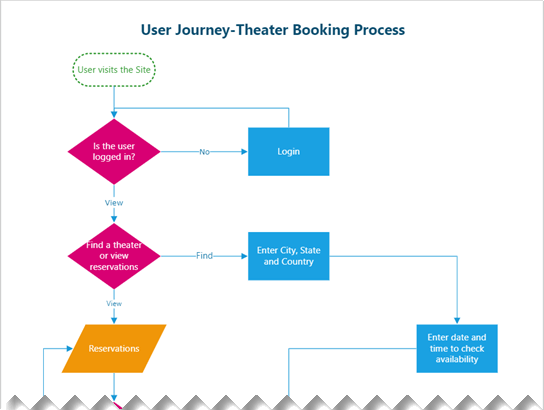
This flowchart template shows the steps for purchasing theater tickets from an online service and how different actions affect the user's Web experience.
A flowchart diagram that details the steps for buying a property.
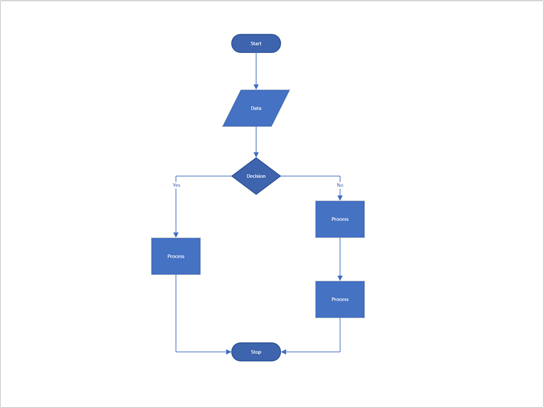
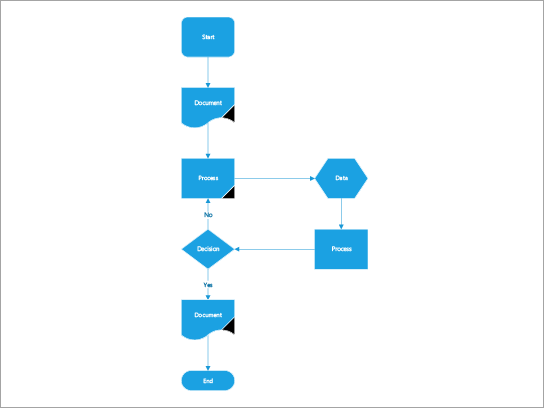
Basic flowchart oriented vertically.
Full process for seeking job candidates (internal and external) for an open position.
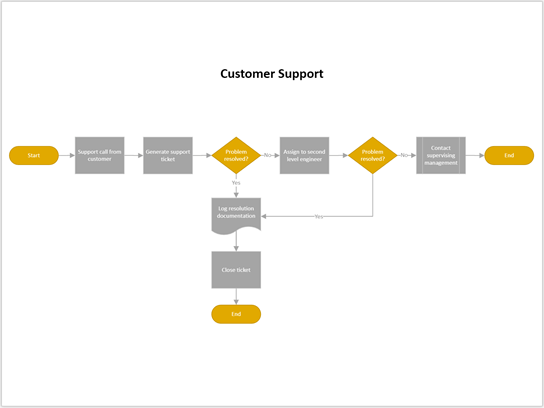
Illustrates the workflow for a customer support team working to solve a customer problem.
Demonstrates an end-to-end audit-process flow.
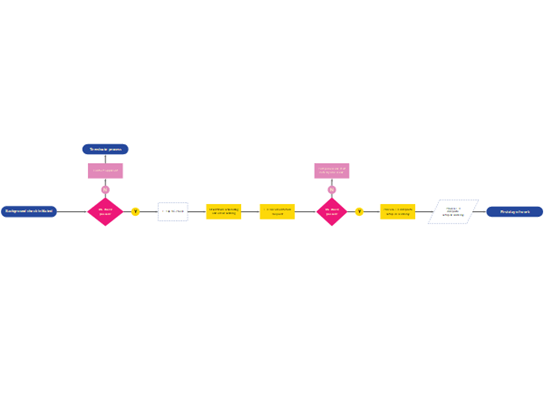
Describes the entire process of performing background checks for job candidates.
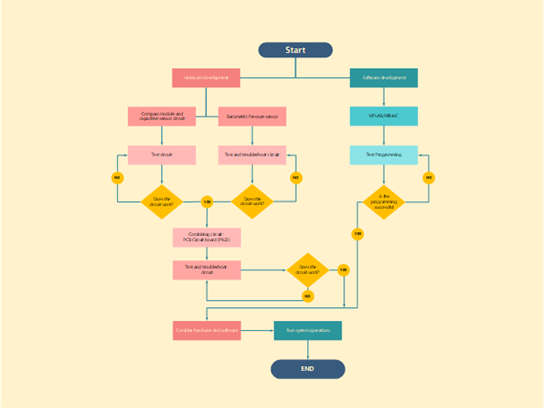
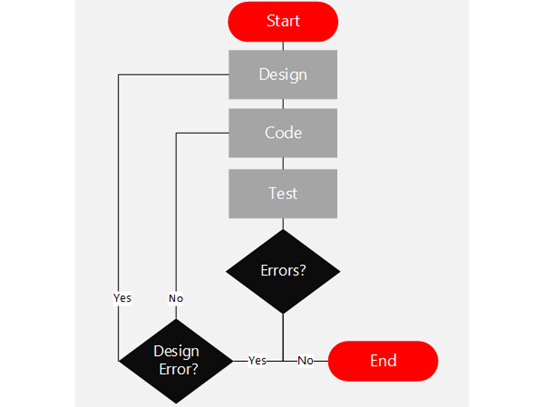
Describes the flow of the hardware or software development process.
Shows how material inspection process flows.
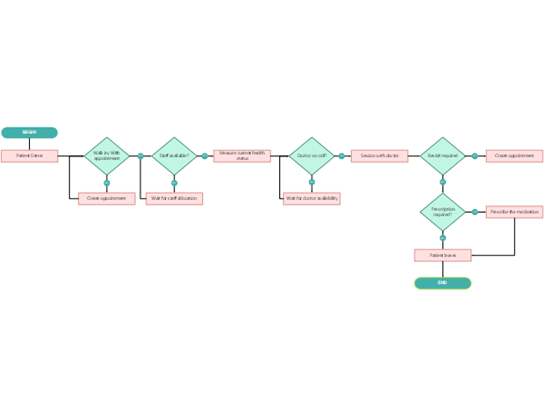
Describes the process of getting medical assistance in a hospital.
Demonstrates a flowchart for scheduling a teacher's class schedule.
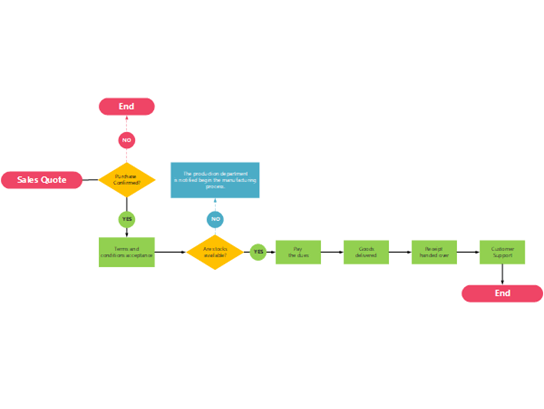
Flowchart that describes the sales quote process.
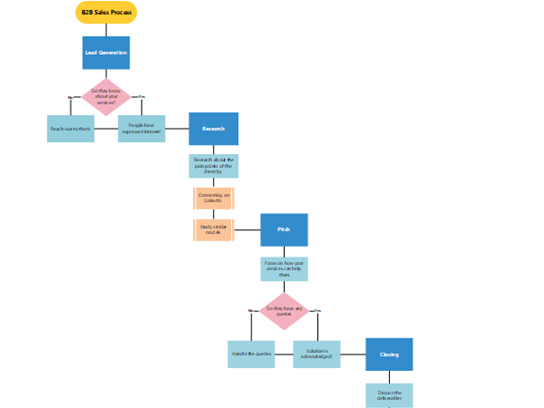
Flowchart showing the process of pitching an idea to a client in business-to-business sales.
Flowchart shapes and connectors show the process of ordering a product on an e-commerce website.
Flowchart shapes and connectors demonstrating how to prototype a software project.
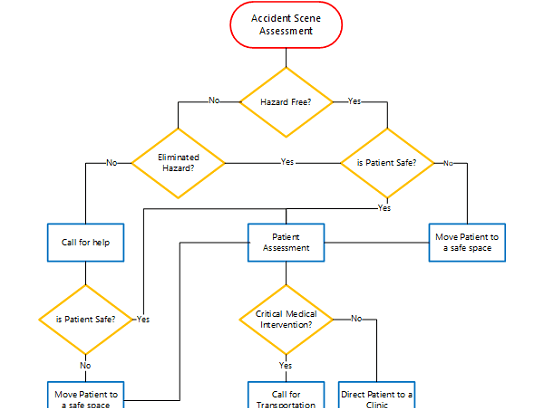
Flowchart demonstrating the steps in assessing an accident scene.
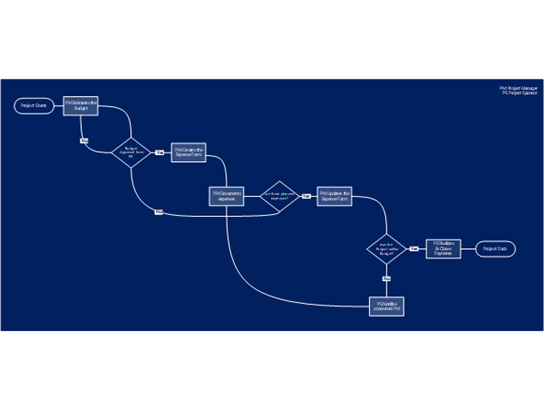
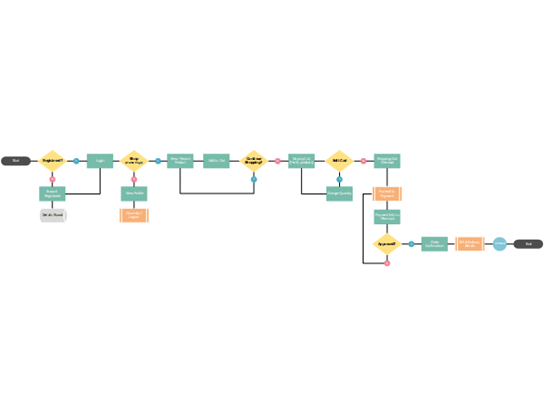
Flowchart showing the process of managing the finances of a project.
Process diagrams
Shapes for illustrating the steps in any sequential process.
The waterfall model illustrates the software development process in a linear sequential flow.
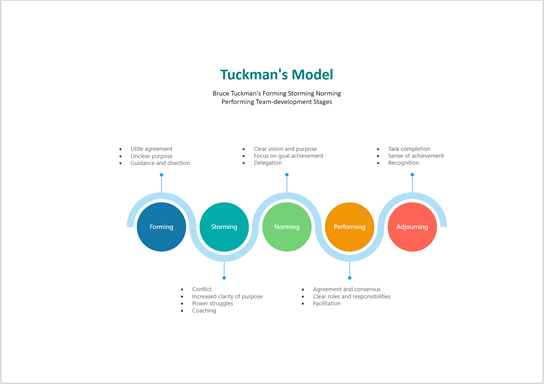
The Tuckman model is an approach to team development that helps develop strategies to move toward its goals.
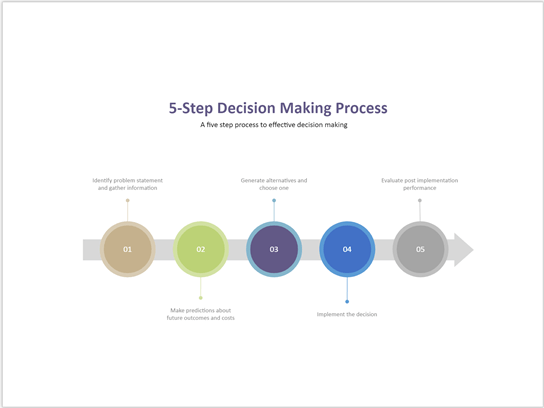
Illustration of fundamental steps in the decision-making process.
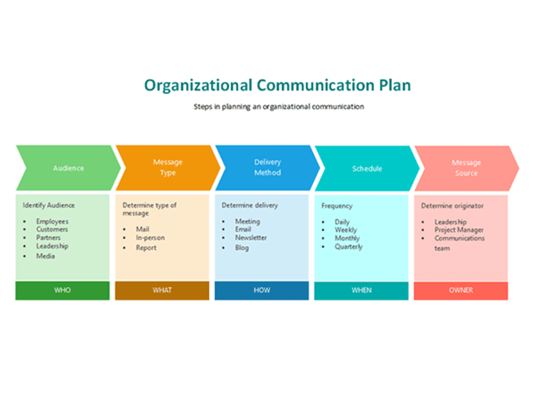
Covers aspects of a communication plan: audience, type of message, delivery method, schedule, and spokesperson.
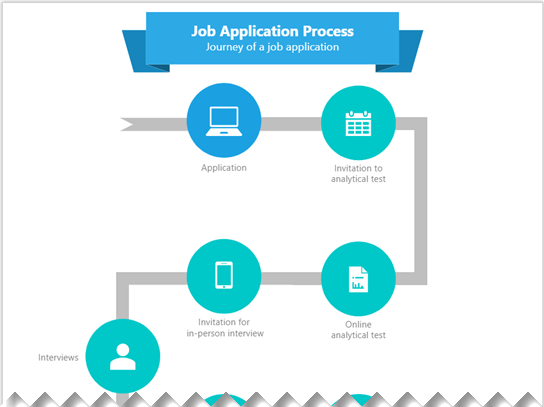
Process diagram illustrating the steps for a job applicant and hiring process.
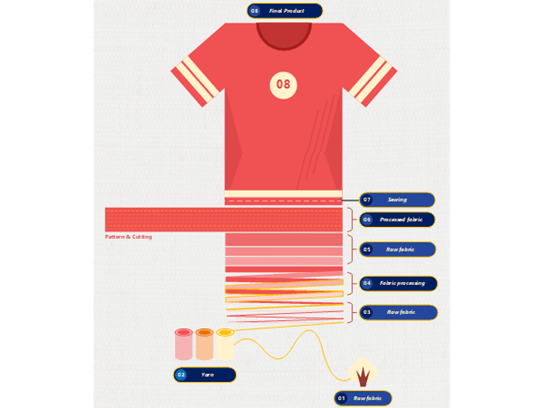
Process diagram that shows how a sports jersey is made, in 8 steps.
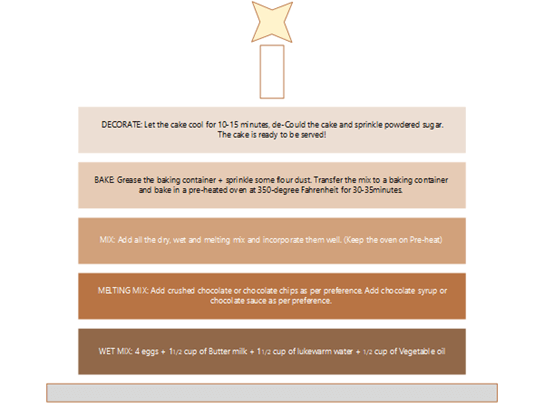
Shows the process of baking a cake, including the ingredients and various stages of mixing, baking, and decoration—illustrated as a cake.
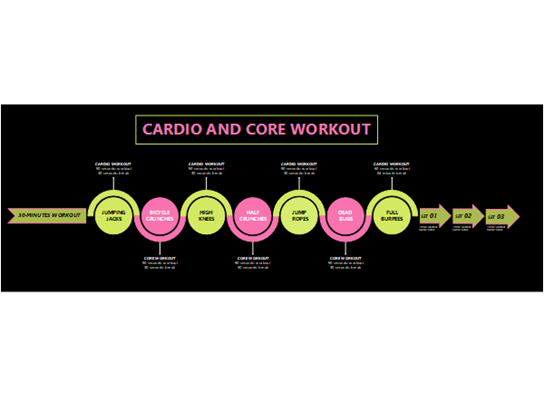
Covers a 30-minutes workout set of cardio and core exercises.
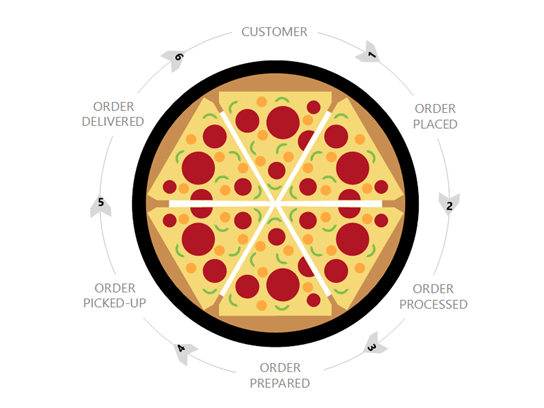
Shows the delivery process from the store to the customer—illustrated in the shape of a pizza.
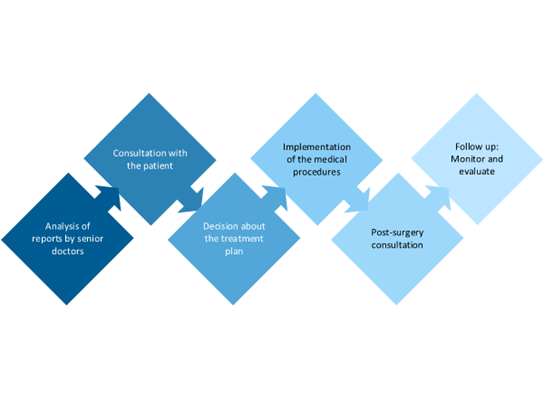
Shows the process involved in patient care, from diagnosis to post-surgery evaluation.
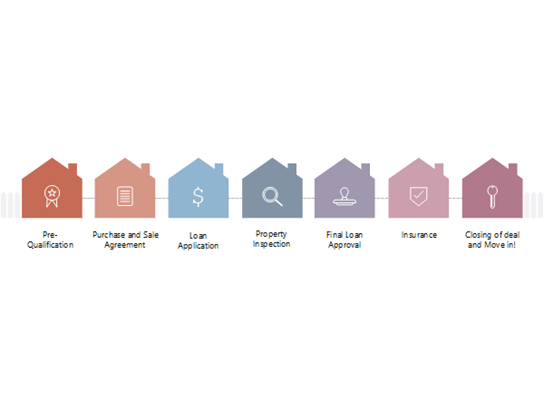
Shows the steps and milestones involved in buying a house with a home loan.
Pyramid diagrams
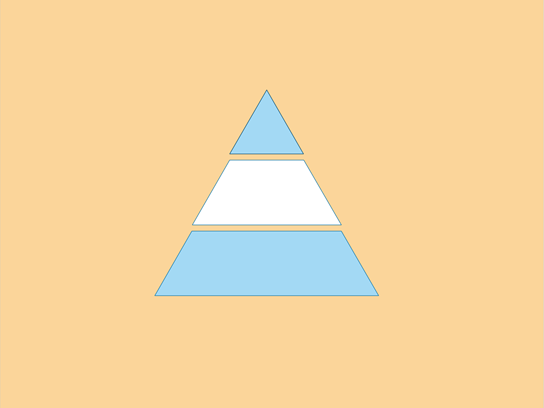
Pyramid diagrams use triangular, pyramidal or conical shapes to show proportional, interconnected, hierarchical relationships.
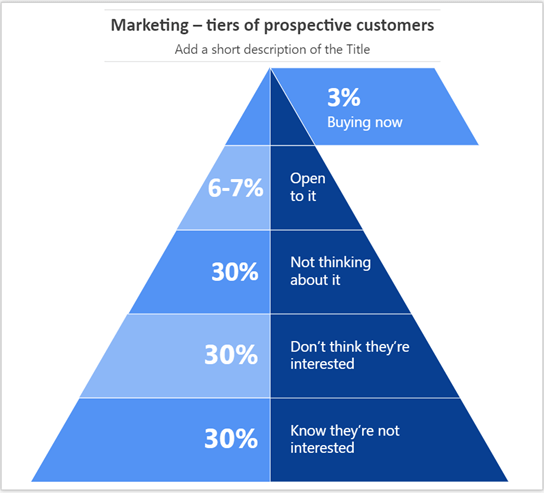
A sample pyramid diagram that represents aspects of a business marketing strategy.
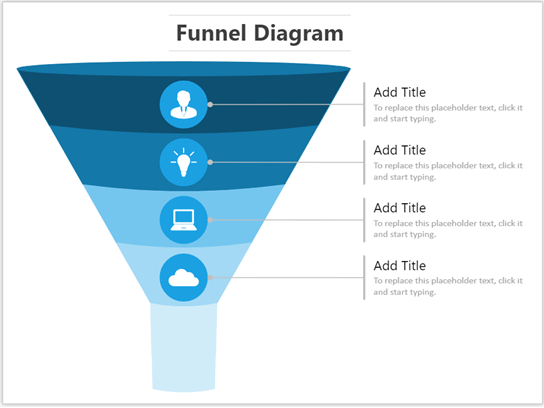
Funnel diagrams can be used to represent different stages of a process and to identify potential problem areas.
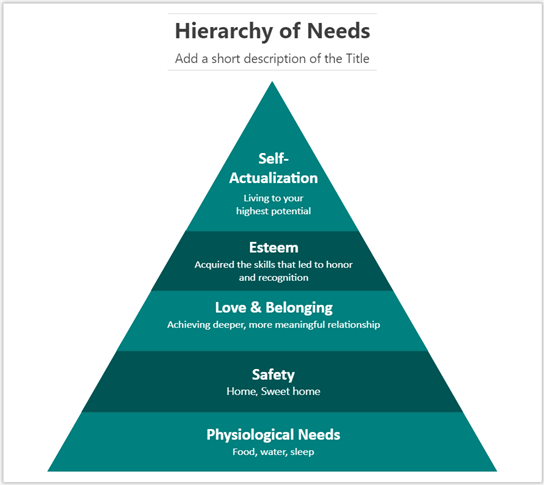
A sample pyramid diagram that represents Maslow's hierarchy of needs.
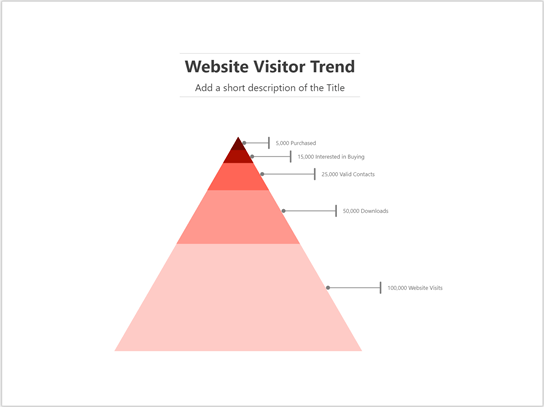
An example of a pyramid diagram. This one shows data about categories of visitors to a web site.
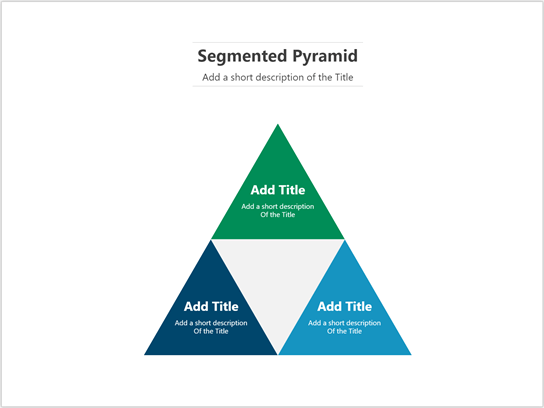
A segmented pyramid diagram can show proportional, interconnected or containment relationships.
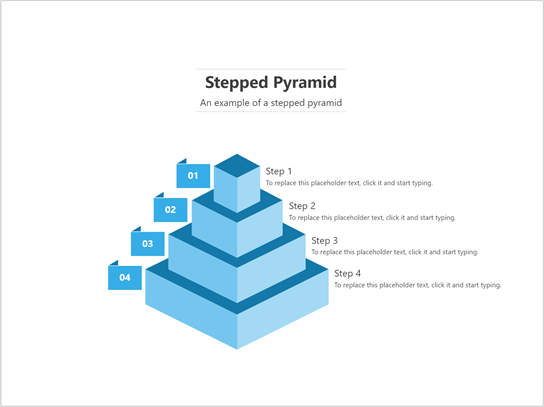
Pyramid diagrams can be used to present a step-by-step progression or to break down the structure of something into meaningful parts.
Venn diagrams

Venn diagrams use overlapping shapes to depict possible logical relationships between two or more sets. Organize information, show associations, similarities, unions, intersections, differences, containments, complements across logical sets.
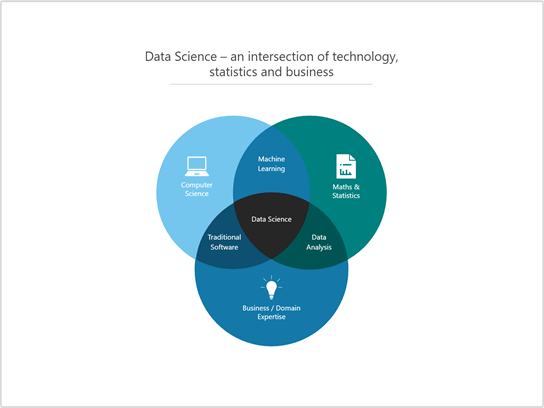
Venn diagram describing data science as an intersection of technology, statistics, and business.
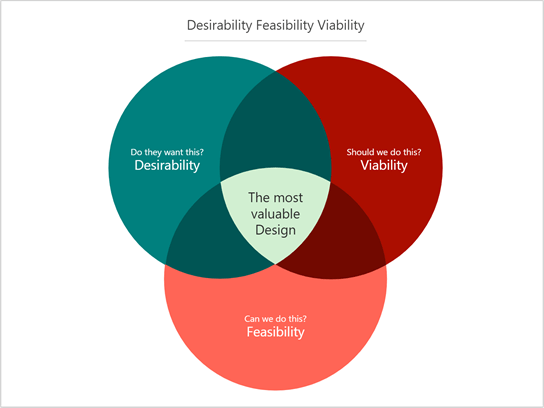
This framework attempts to balance what is desirable from a customer point of view with what is technologically feasible and economically viable.
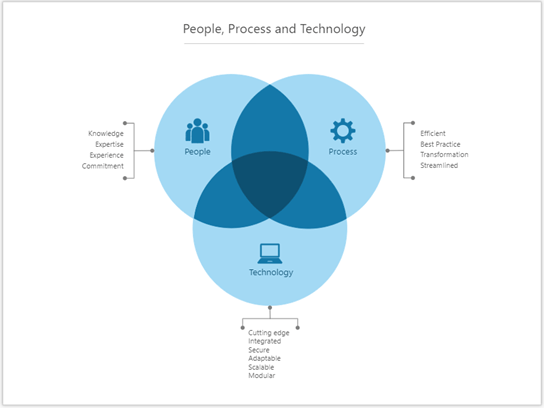
Illustrates three elements of organizational transformation.
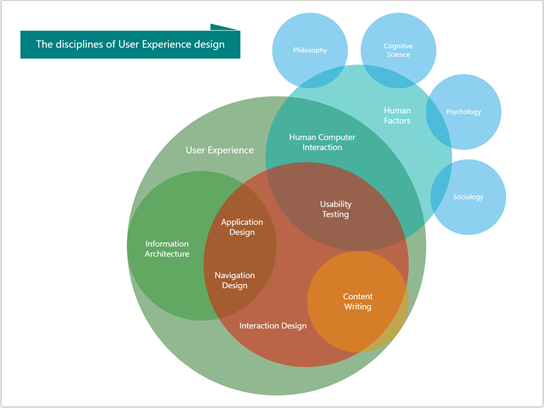
Illustrates the inter-relationships of the many elements of user experience design.
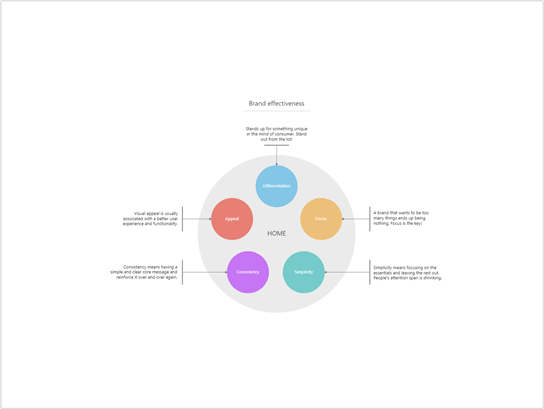
Five factors for measuring brand effectiveness.


