使用 Windows 版 Excel 分析資料
建立圖表
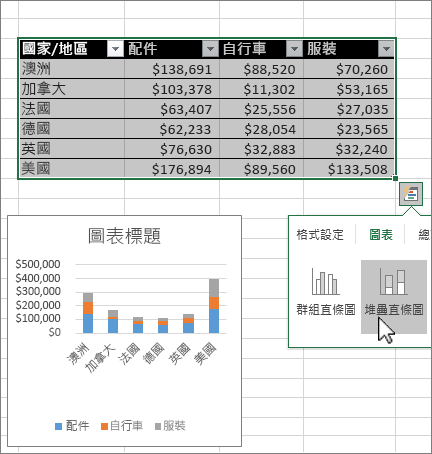
使用 [快速分析] 工具,可為您的資料挑選合適的圖表。
-
選取您要在圖表中顯示的資料。
-
選取您已選取的儲存格右下角的 [快速分析] 按鈕

-
選取 [圖表],然後將游標停留在各個選項上,並挑選您要的圖表。
試試看! 選取 [檔案] > [新增],選取 [導覽],然後選取 [圖表] 索引標籤。 如需詳細資訊,請參閱建立圖表。
使用條件式格式設定
使用 [快速分析] 來醒目提示重要的資料,或是呈現資料的趨勢。
-
選取要設定格式化條件的資料。
-
選取您已選取的儲存格右下角的 [快速分析] 按鈕
-
選取 [設定格式],然後將游標停留在各個選項上,並挑選您要的選項。
試試看! 選取 [檔案] > [新增],選取 [導覽],然後選取 [分析] 索引標籤。
![使用 [快速分析] 來醒目提示資料](https://support.content.office.net/zh-tw/media/fc487b6e-a096-48cf-8bef-afaf0d1ac67c.png)
下一步: Windows 版 Excel 的秘訣


Need more help?
Want more options?
探索訂閱權益、瀏覽訓練課程、瞭解如何保護您的裝置等等。


社群可協助您詢問並回答問題、提供意見反應,以及聆聽來自具有豐富知識的專家意見。