
-
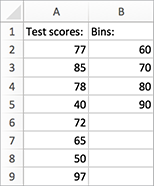
Select your data range. (Sample data for a histogram below).
-
Click Insert > Insert Statistic Chart > Histogram.
Where is it?
Create a histogram


需要更多協助嗎?
想要其他選項嗎?
Explore subscription benefits, browse training courses, learn how to secure your device, and more.


Communities help you ask and answer questions, give feedback, and hear from experts with rich knowledge.


