
Add a chart legend
Click the chart to which you want to add a legend, click the Chart Elements button
 , and then click Legend.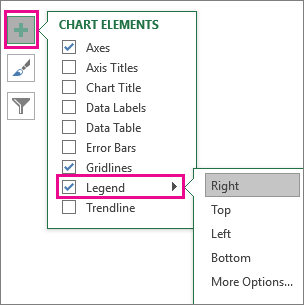
To change the location of the legend, click the arrow next to Legend and then click the location that you want.
Tip
- By default, a legend does not overlap the chart. If you have space constraints, you may be able to reduce the size of the chart by clicking More Options and then clearing the Show the legend without overlapping the chart check box.
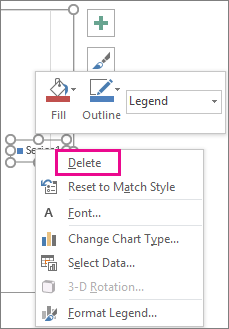
- To remove a legend, right-click it, and then click Delete.
Format a chart legend
After you add the chart legend, you can change how it looks.
Change font or font size
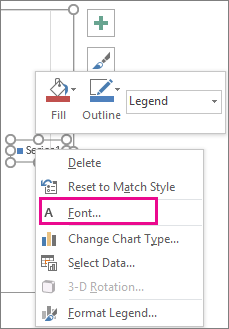
Right-click the legend, and then select Font.
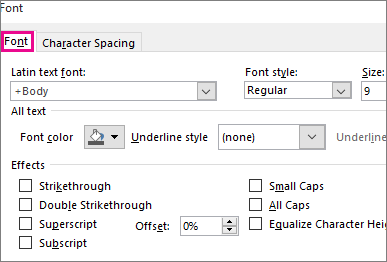
On the Font tab, make the changes that you want to the font or font size.
Change legend border or background
Right-click the legend, and then select Format Legend.
In the Format Legend task pane, pick the options that you want.

Tip
Add an effect to make your legend stand out. Select Effects and then pick the effect that you want. A wide variety of effects is available, including shadows, glows, and soft edges. (Just be careful not to go overboard: you probably don't want to clutter the presentation of your data.)
