

After you create a chart, you can change the data series in two ways:
- Use the Select Data Source dialog box to edit the data in your series or rearrange them on your chart.
- Use chart filters to show or hide data in your chart.
Edit or rearrange a series
Right-click your chart, and then choose Select Data.
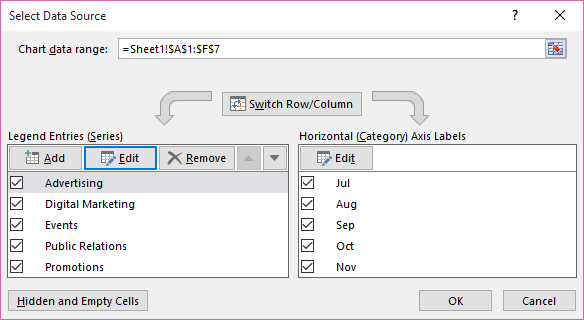
In the Legend Entries (Series) box, click the series you want to change.
Select Edit, make your changes, and select OK.
Changes you make may break links to the source data on the worksheet.To rearrange a series, select it, and then select Move Up
 or Move Down
 .
.
You can also add a data series or remove them in this dialog box by clicking Add or Remove. Removing a data series deletes it from the chart—you can't use chart filters to show it again.
If you want to rename a data series, see Rename a data series.
Filter data in your chart
Let's start with chart filters.
- Select your chart.
- Select the Chart Filters button
 next to the chart.
 - On the Values tab, check or uncheck the series or categories you want to show or hide.
- Select Apply.
- If you want to edit or rearrange the data in your series, choose Select Data, and then follow steps 2-4 in the next section.


