
If your PowerPoint presentation contains a chart, you can edit the chart data directly in PowerPoint, whether the chart is embedded in or linked to your presentation. You can also update or refresh the data in a linked chart without having to go to the program in which you created the chart.
Change chart data on a slide
On the slide, select the chart that you want to change. When you do so, two contextual tabs appear on the ribbon: Chart Design and Format. If you do not see the Chart Design and Format tabs, make sure that you select the chart to select it.
On Chart Design tab, in the Data group, select Edit Data.
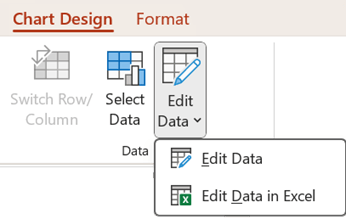
Do one of the following:
To edit the data in PowerPoint, select Edit Data. This will open a window from your spreadsheet.
Note
If the workbook you're working with has special startup requirements, such as enabling content, you'll need to also do that within the window.
To edit the data directly in Excel, select Edit Data in Excel.
Make the changes you want. They will be reflected in the chart in PowerPoint.
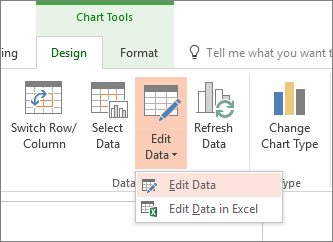
What if the "Edit Data" button is unavailable?
If the Edit data button isn't available, read the troubleshooting article from the Office Answers forum:
Insert a chart into a PowerPoint presentation
To learn how to insert an Excel chart into a presentation, see Use charts and graphs in your presentation.
