

You can move a chart to any location on a worksheet or to a new or existing worksheet. You can also change the size of the chart for a better fit.
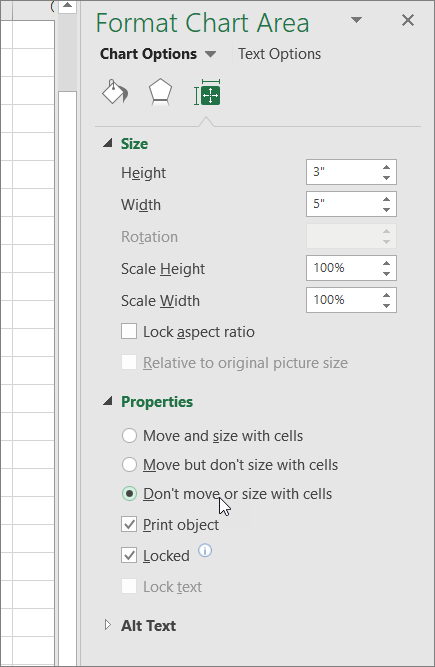
By default, a chart moves and sizes with cells. When you change the size of cells on the worksheet, the size of the chart adjusts accordingly. You can change this positioning option if you don't want to move or resize the chart together with the worksheet cells.
Move a chart to another location in a worksheet
To move a chart, drag it to the location that you want.
Move a chart to another worksheet
Select the chart.
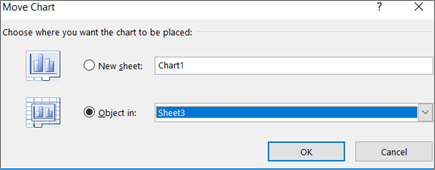
This selection displays the Chart Styles option on the ribbon.Under Chart Styles, on the Chart Design tab, in the Location group, select Move Chart.

Select one of the following options:
To move the chart to a new worksheet, select New sheet, and then in the New sheet box, type a name for the worksheet.
To move the chart as an object in another worksheet, select Object in, and then in the Object in box, select the worksheet in which you want to place the chart.
Tip
You can also place a chart in another chart sheet.
Resize a chart
To resize a chart, use one of the following methods:
To change the size manually, select the chart, and then drag the sizing handles to the size that you want.
To use specific height and width measurements, on the Format tab, in the Size group, enter the size in the Height and Width boxes.

To change the size and scaling of the chart, on the Format tab, in the Size group, click the Dialog Box Launcher
 . Then in the Size boxes, enter the numbers that you want.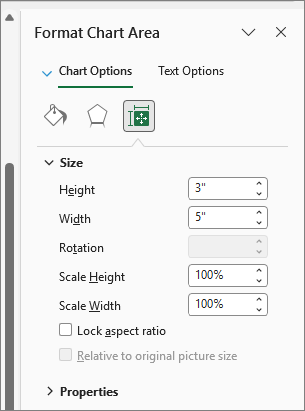
Prevent a chart from moving and sizing with cells on the worksheet
Select the chart.
This selection displays the Chart Styles option on the ribbon.Select the Format tab, in the Size group, click the Dialog Box Launcher
.
In the Format Chart Area pane, select Properties, and then select the appropriate option.
Need more help?
You can always ask an expert in the Excel Tech Community or get support in Communities.