
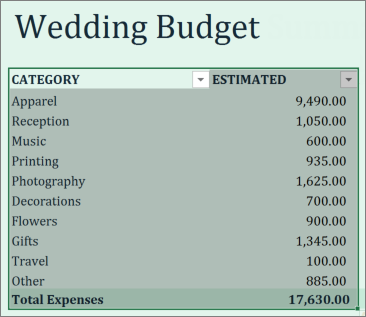
Select your data range. The following example shows data from two columns have been selected for the chart.
Click Insert > Recommended Charts .
Where is it?Select the type of chart you want and click OK.
Select your data range. The following example shows data from two columns have been selected for the chart.
Click Insert > Recommended Charts .
Where is it?
Select the type of chart you want and click OK.