
You can add predefined lines or bars to charts in several apps for Office. By adding lines, including series lines, drop lines, high-low lines, and up-down bars, to specific chart can help you analyze the data that is displayed. If you no longer want to display the lines or bars, you can remove them.
New to formatting charts in Excel? Click here for a free 5 minute video training on how to format your charts.
Specific line and bar types are available in 2-D stacked bar and column charts, line charts, pie of pie and bar of pie charts, area charts, and stock charts.
Predefined line and bar types that you can add to a chart
Depending on the chart type that you use, you can add one of the following lines or bars:
-
Series lines These lines connect the data series in 2-D stacked bar and column charts to emphasize the difference in measurement between each data series. Pie of pie and bar of pie charts display series lines by default to connect the main pie chart with the secondary pie or bar chart.

-
Drop lines Available in 2-D and 3-D area and line charts, these lines extend from data points to the horizontal (category) axis to help clarify where one data marker ends and the next data marker starts.

-
High-low lines Available in 2-D line charts and displayed by default in stock charts, high-low lines extend from the highest value to the lowest value in each category.

-
Up-down bars Useful in line charts with multiple data series, up-down bars indicate the difference between data points in the first data series and the last data series. By default, these bars are also added to stock charts, such as Open-High-Low-Close and Volume-Open-High-Low-Close.

Add predefined lines or bars to a chart
-
Click the 2-D stacked bar, column, line, pie of pie, bar of pie, area, or stock chart to which you want to add lines or bars.
This displays the Chart Tools, adding the Design, Layout, and Format tabs.
-
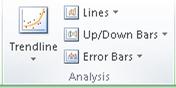
On the Layout tab, in the Analysis group, do one of the following:
-
Click Lines, and then click the line type that you want.
Note: Different line types are available for different chart types.
-
Click Up/Down Bars, and then click Up/Down Bars.
-
Tip: You can change the format of the series lines, drop lines, high-low lines, or up-down bars that you display in a chart by right-clicking the line or bar, and then clicking Format <line or bar type> .
Remove predefined lines or bars from a chart
-
Click the 2-D stacked bar, column, line, pie of pie, bar of pie, area, or stock chart that displays predefined lines or bars.
This displays the Chart Tools, adding the Design, Layout, and Format tabs.
-
On the Layout tab, in the Analysis group, click Lines or Up/Down Bars, and then click None to remove lines or bars from a chart.
Tip: You can also remove lines or bars immediately after you add them to the chart by clicking Undo on the Quick Access Toolbar or by pressing CTRL+Z.
You can add other lines to any data series in an area, bar, column, line, stock, xy (scatter), or bubble chart that is 2-D and not stacked.
Add other lines
-
This step applies to Word for Mac only: On the View menu, click Print Layout.
-
In the chart, select the data series that you want to add a line to, and then click the Chart Design tab.
For example, in a line chart, click one of the lines in the chart, and all the data marker of that data series become selected.
-
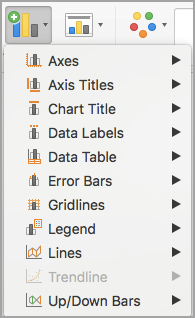
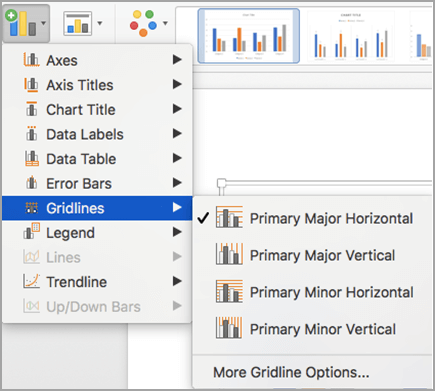
Click Add Chart Element, and then click Gridlines.
-
Choose the line option that you want or click More Gridline Options.
Depending on the chart type, some options may not be available.
Remove other lines
-
This step applies to Word for Mac only: On the View menu, click Print Layout.
-
Click the chart with the lines, and then click the Chart Design tab.
-
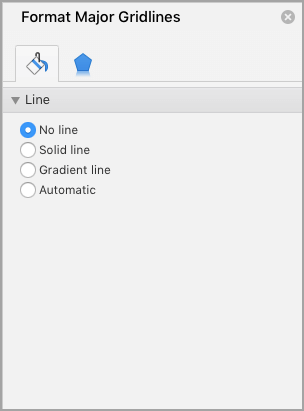
Click Add Chart Element, click Gridlines, and then click More Gridline Options.
-
Select No line.
You can also click the line and press DELETE .


