
試試看!
建立樞紐分析表,以結構化的格式製作摘要並分析您的資料。 樞紐分析圖是一種為資料新增資料視覺效果的絕佳方式。
|
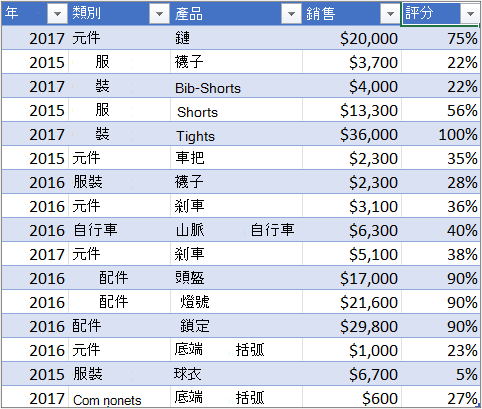
家庭支出資料 |
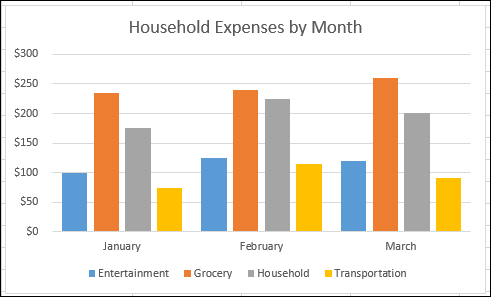
對應的樞紐分析圖 |
|
|
|
建立樞紐分析圖
-
選取您表格中的一個儲存格。
-
選取[插入>樞紐分析圖
![功能區的 [樞紐分析圖] 選項](https://support.content.office.net/zh-tw/media/fb4b7b12-d0f6-48a6-afe5-23930a1687b4.png)
-
選取 [確定]。
從樞紐分析表建立圖表
-
選取您表格中的一個儲存格。
-
選取樞紐分析表工具>分析>樞紐分析圖
-
選取圖表。
-
選取 [確定]。
想要更多資訊嗎?


Need more help?
Want more options?
探索訂閱權益、瀏覽訓練課程、瞭解如何保護您的裝置等等。


社群可協助您詢問並回答問題、提供意見反應,以及聆聽來自具有豐富知識的專家意見。