
試試看!
Excel 的 [快速分析] 按鈕能讓您立即建立不同的圖表類型 (包括折線與直條圖),或是新增稱為走勢圖的縮圖圖表。
-
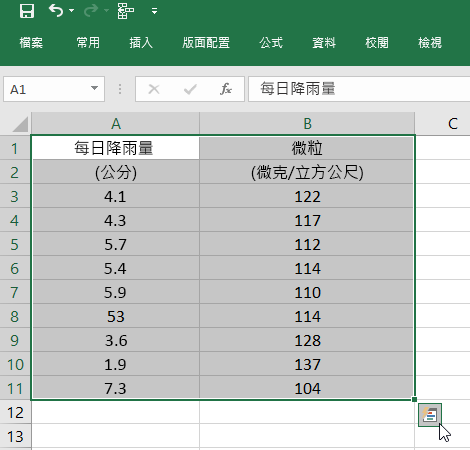
選取儲存格範圍。
-
選取顯示在所選取資料右下方的 [快速分析] 按鈕。
或者,按 Ctrl + Q。
-
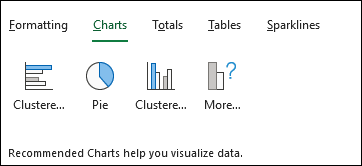
選取 [圖表]。
-
將游標停留在圖表類型上來預覽圖表,並選取您想要的圖表。
想要更多資訊嗎?


Need more help?
Want more options?
探索訂閱權益、瀏覽訓練課程、瞭解如何保護您的裝置等等。


社群可協助您詢問並回答問題、提供意見反應,以及聆聽來自具有豐富知識的專家意見。