Use the Field List
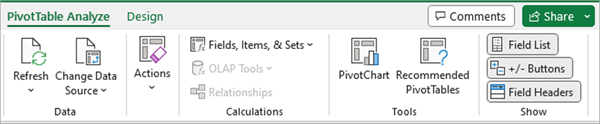
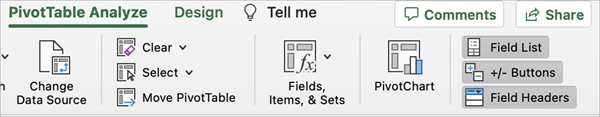
The Field List should appear when you click anywhere in the PivotTable. If you click inside the PivotTable but don't see the Field List, open it by clicking anywhere in the PivotTable. Then, show the PivotTable Tools on the ribbon and click Analyze> Field List.
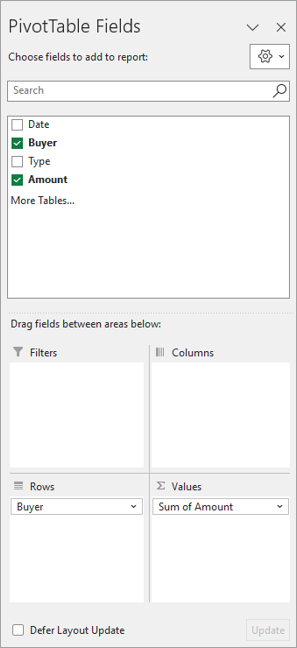
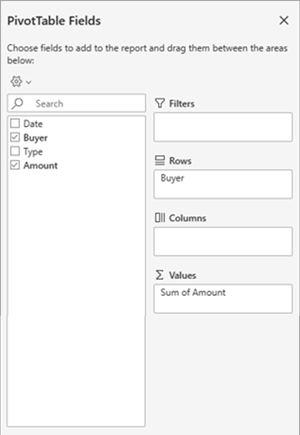
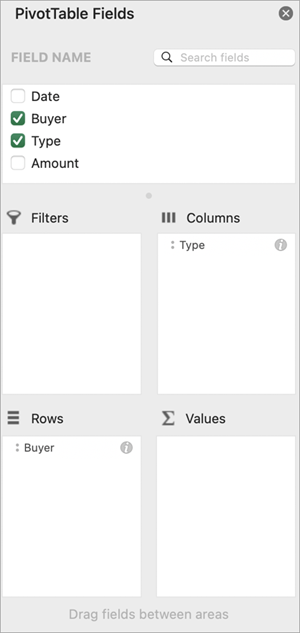
The Field List has a field section in which you pick the fields you want to show in your PivotTable, and the Areas section (at the bottom) in which you can arrange those fields the way you want.
Tip
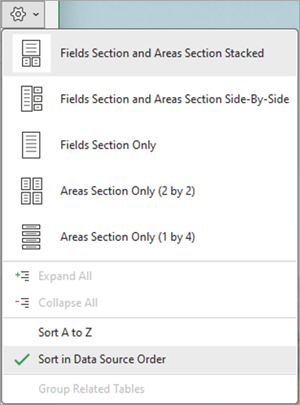
If you want to change how sections are shown in the Field List, click the Tools button
 and then pick the layout you want.
Add, rearrange, and delete fields in the Field List
Use the field section of the Field List to add fields to your PivotTable, by checking the box next to field names to place those fields in the default area of the Field List.
Note
Typically, nonnumeric fields are added to the Rows area, numeric fields are added to the Values area, and Online Analytical Processing (OLAP) date and time hierarchies are added to the Columns area.
Use the areas section (at the bottom) of the Field List to rearrange fields the way you want by dragging them between the four areas.
Fields that you place in different areas are shown in the PivotTable as follows:
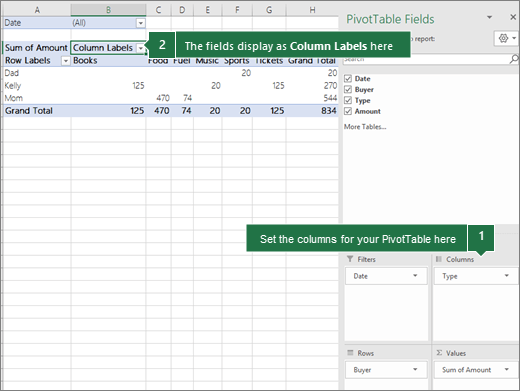
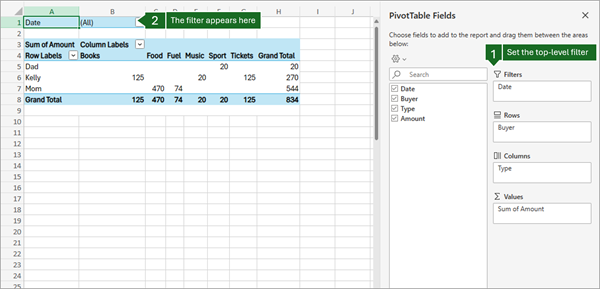
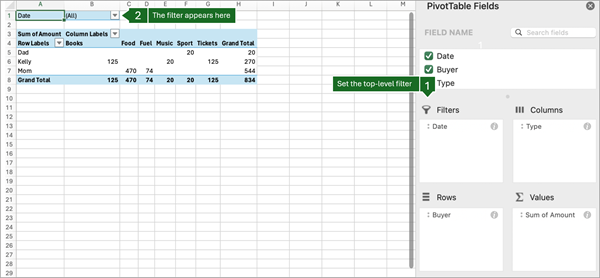
Filters area fields are shown as top-level report filters above the PivotTable, like this:

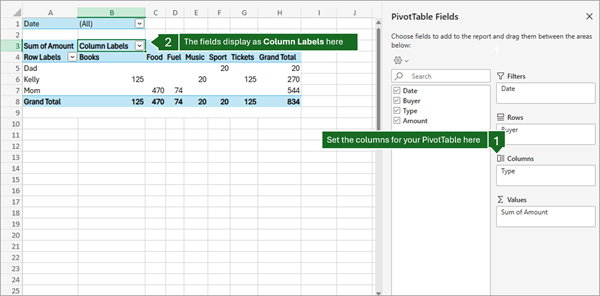
Columns area fields are shown as Column Labels at the top of the PivotTable, like this:
Depending on the hierarchy of the fields, columns may be nested inside columns that are higher in position.
Depending on the hierarchy of the fields, rows may be nested inside rows that are higher in position.
If you have more than one field in an area, you can rearrange the order by dragging the fields into the precise position you want.
To delete a field from the PivotTable, drag the field out of its areas section. You can also remove fields by clicking the down arrow next to the field and then selecting Remove Field.
Use the Field List
The Field List should appear when you click anywhere in the PivotTable. If you click inside the PivotTable but don't see the Field List, open it by clicking anywhere in the PivotTable. Then, show the PivotTable Tools on the ribbon and click Analyze> Field List.
The Field List has a field section in which you pick the fields you want to show in your PivotTable, and the Areas section (at the bottom) in which you can arrange those fields the way you want.
Add, rearrange, and delete fields in the Field List
Use the field section of the Field List to add fields to your PivotTable, by checking the box next to field names to place those fields in the default area of the Field List.
Note
Typically, nonnumeric fields are added to the Rows area, numeric fields are added to the Values area, and Online Analytical Processing (OLAP) date and time hierarchies are added to the Columns area.
Use the areas section (at the bottom) of the Field List to rearrange fields the way you want by dragging them between the four areas.
Fields that you place in different areas are shown in the PivotTable as follows:
Filters area fields are shown as top-level report filters above the PivotTable, like this:
Columns area fields are shown as Column Labels at the top of the PivotTable, like this:
Depending on the hierarchy of the fields, columns may be nested inside columns that are higher in position.
Depending on the hierarchy of the fields, rows may be nested inside rows that are higher in position.
If you have more than one field in an area, you can rearrange the order by dragging the fields into the precise position you want.
To delete a field from the PivotTable, drag the field out of its areas section. You can also remove fields by clicking the down arrow next to the field and then selecting Remove Field.
Use the Field List
The Field List should appear when you click anywhere in the PivotTable. If you click inside the PivotTable but don't see the Field List, open it by clicking anywhere in the PivotTable. Then, show the PivotTable Tools on the ribbon and click Analyze> Field List.
<IMG_11> new below
The Field List has a field section in which you pick the fields you want to show in your PivotTable, and the Areas section (at the bottom) in which you can arrange those fields the way you want.
Add, rearrange, and delete fields in the Field List
Use the field section of the Field List to add fields to your PivotTable, by checking the box next to field names to place those fields in the default area of the Field List.
Note
Typically, nonnumeric fields are added to the Rows area, numeric fields are added to the Values area, and Online Analytical Processing (OLAP) date and time hierarchies are added to the Columns area.
Use the areas section (at the bottom) of the Field List to rearrange fields the way you want by dragging them between the four areas.
Fields that you place in different areas are shown in the PivotTable as follows:
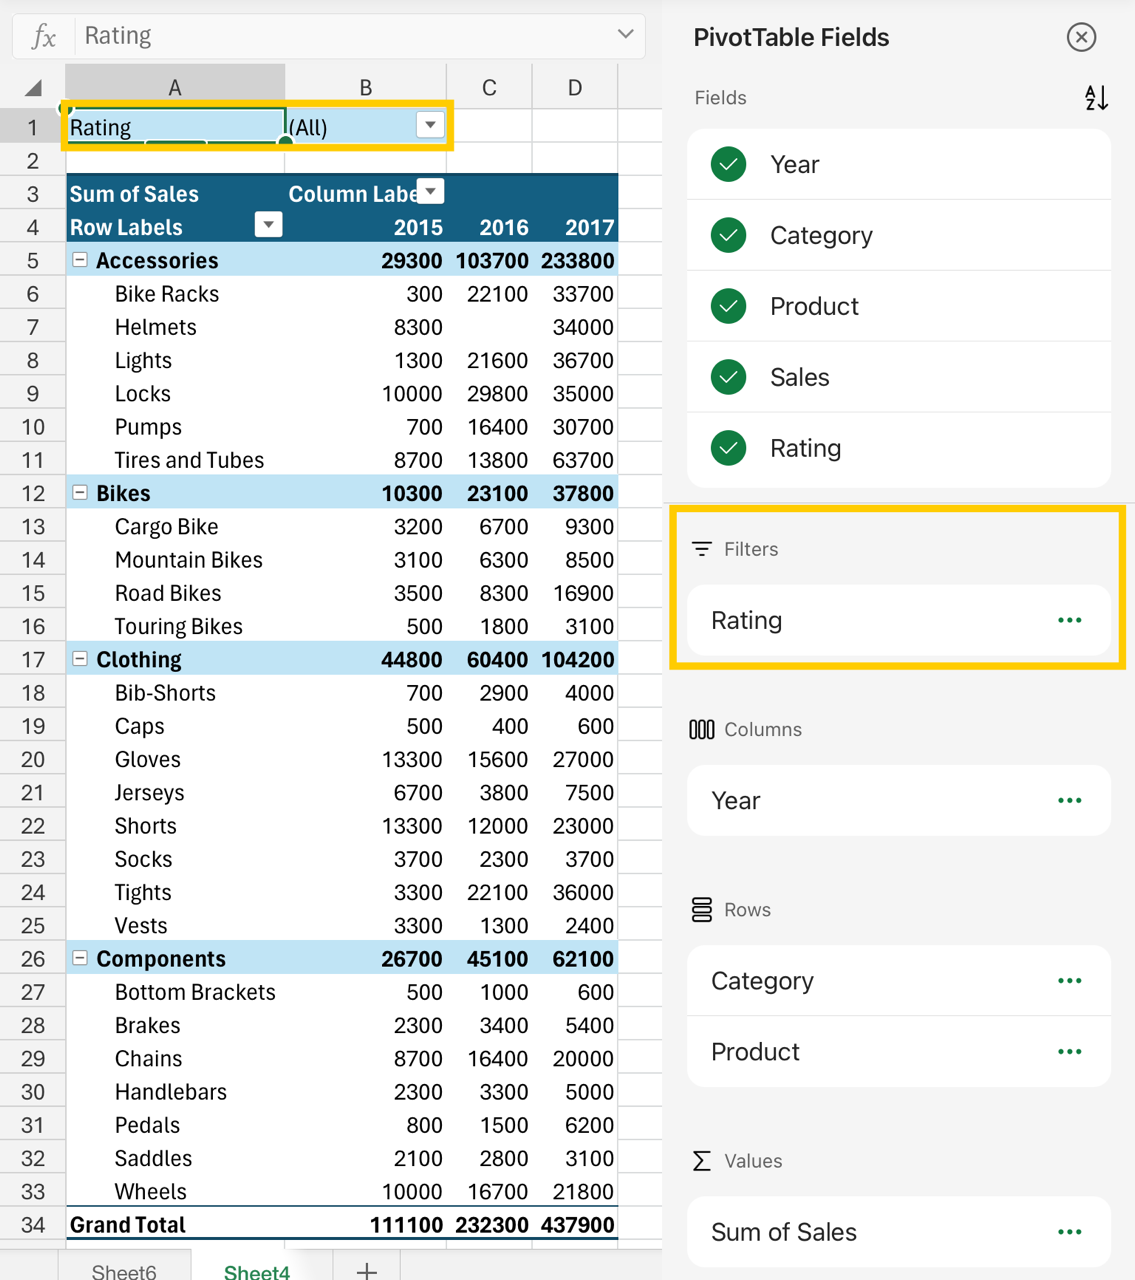
Filters area fields are shown as top-level report filters above the PivotTable, like this:
Columns area fields are shown as Column Labels at the top of the PivotTable, like this:
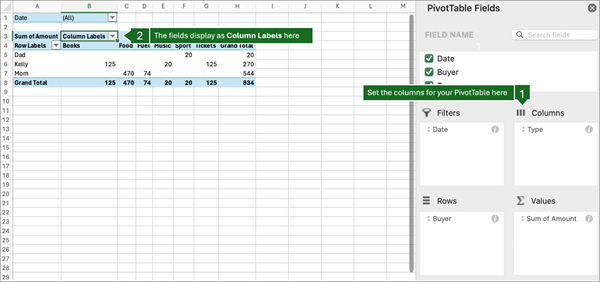
Depending on the hierarchy of the fields, columns may be nested inside columns that are higher in position.
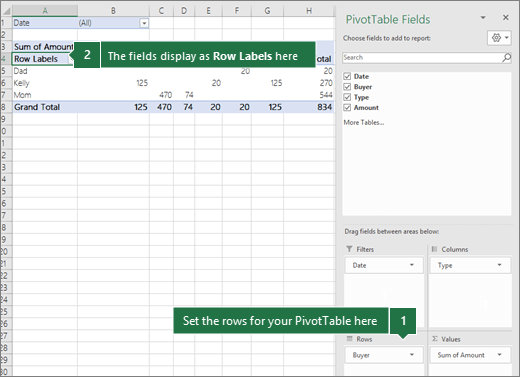
- Rows area fields are shown as Row Labels on the left side of the PivotTable, like this:
16c
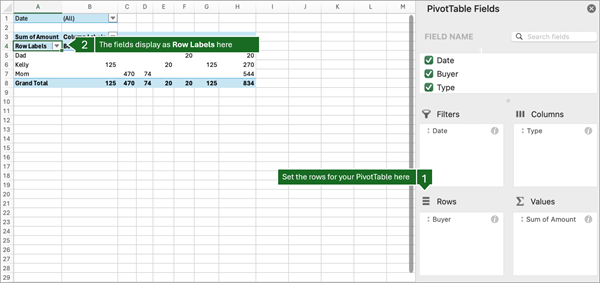
Depending on the hierarchy of the fields, rows may be nested inside rows that are higher in position.
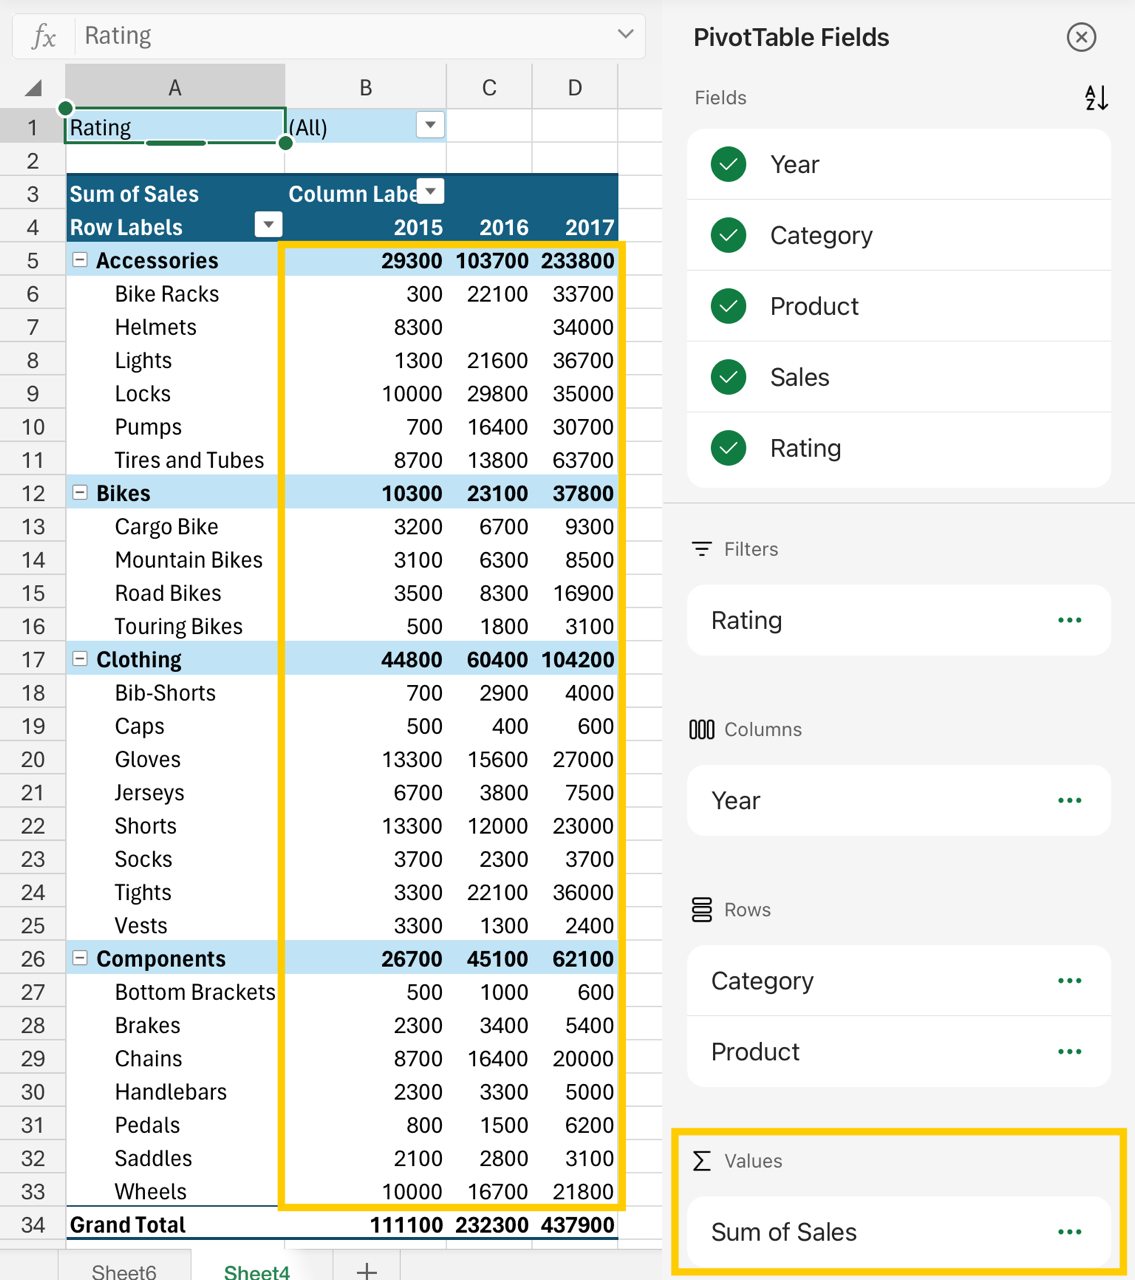
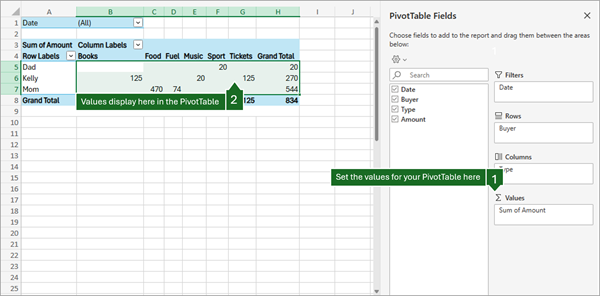
- Values area fields are shown as summarized numeric values in the PivotTable, like this:
17c

PivotTable on iPad is available to customers running Excel on iPad version 2.82.205.0 and above. To access this feature, please ensure your app is updated to the latest version through the App Store.
Use the Field List
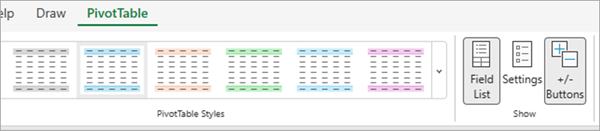
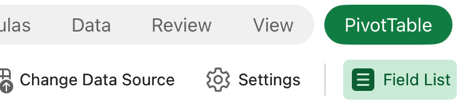
If the field list is no longer visible, go to the PivotTable tab, swipe left and select Field List to display the field list.
The Field List has a field section in which you pick the fields you want to show in your PivotTable, and the Areas section (at the bottom) in which you can arrange those fields the way you want.

Add, rearrange, and delete fields in the Field List
Use the field section of the Field List to add fields to your PivotTable, by checking the box next to field names to place those fields in the default area of the Field List.
Note
Typically, non-numeric fields are added to the Rows area, date and time fields are added to the Columns area, and numeric fields are added to the Values area.
Use the areas section (at the bottom) of the Field List to rearrange fields the way you want by dragging them between the four areas.
Fields that you place in different areas are shown in the PivotTable as follows:
- Filters area fields are shown as top-level report filters above the PivotTable, like this:
- Columns area fields are shown as Column Labels at the top of the PivotTable, like this:

Depending on the hierarchy of the fields, columns may be nested inside columns that are higher in position.
- Rows area fields are shown as Row Labels on the left side of the PivotTable, like this:
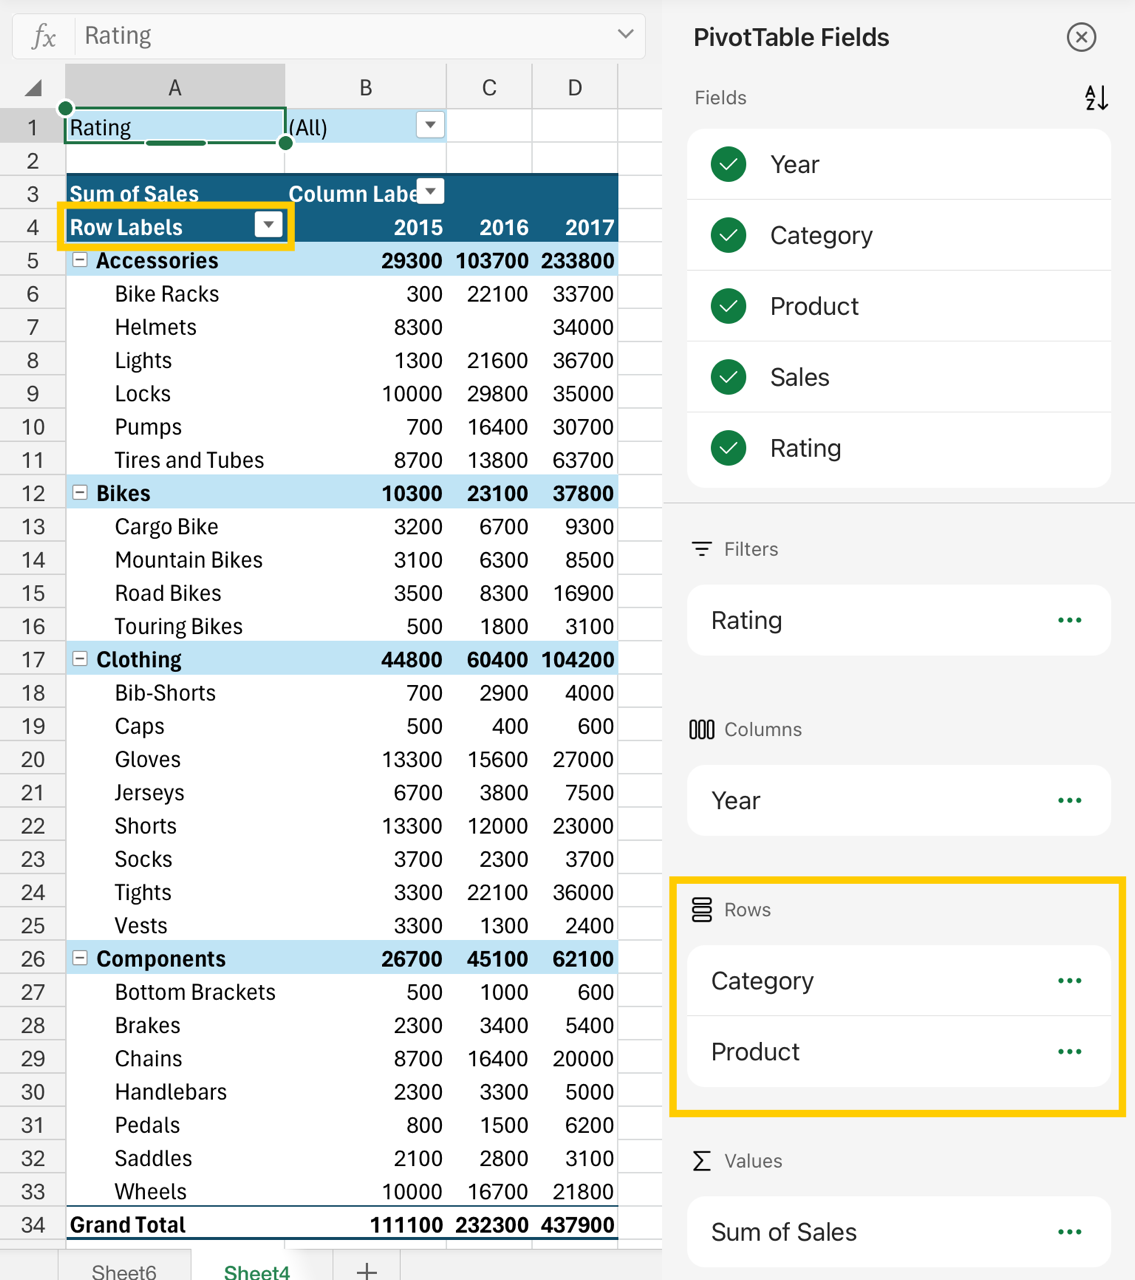
Depending on the hierarchy of the fields, rows may be nested inside rows that are higher in position.
- Values area fields are shown as summarized numeric values in the PivotTable, like this: