Identify support needs and monitor student learning with views of grade average and distribution, assignment progress status, and more in the Assignments and grades report in Education Insights. All data can be organized at the class level, by individual students, or on an assignment-to-assignment basis, helping you to inform and adapt your teaching strategy with holistic views of each student.
To find assignment and grade data:
- Navigate to your desired class and select the Insights tab.
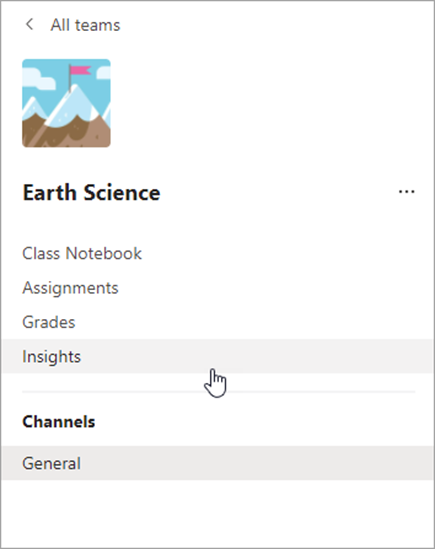
2. From the class overview page, select Assignments from your reports.

3. When you enter the Assignments and Grades report, it will automatically show all students, all assignments, all categories.

- Select the calendar dropdown to narrow or expand your time frame.
- Enter a student's name in the Search student box to narrow the data to reflect a specific student.
- Select All assignments, then choose an assignment to narrow the data to student performance on that assignment.
- Select All tags to open a dropdown of all the available tags. Learn to create tags yourself when creating an assignment.
Use the tabs below to explore the views available in the Assignments and Grades report.
Assignments
The assignments panel has a number of tabs to help identify where students are and who might need support in understanding an assignment or a push before they miss a deadline.

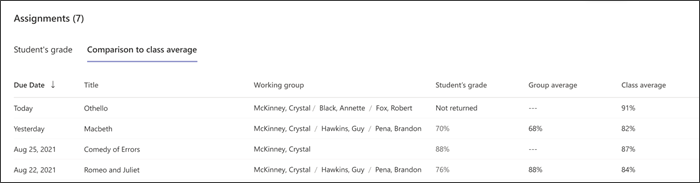
Grades
Select the Grades tab to view average grade by assignment. Yellow highlights assignments which at least one student has not yet turned in. Selecting a yellow datapoint opens a list of assignments that still need to be graded and returned to students.
Progress status
Select the Progress status tab to view what step in the completion of an assignment your students are on.
Green indicates that the step has been completed for all students.
Yellow indicates that action needs to be taken soon.
- In the Viewed by students column, yellow means the due date is within the next 24 hours, so a reminder may be helpful if many students have yet to view the assignment.

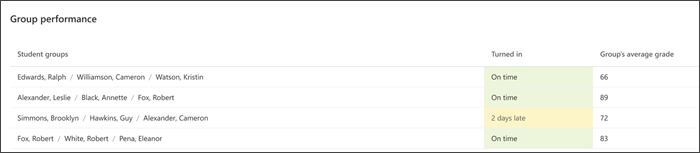
Turn-in statistics
Select the Turn-in statistics tab to easily view which assignments are missing, which assignments were turned in late, and any assignments that were returned for revision. Clicking on any number in the chart will open the list of students in that category.

Average grade
View grade averages for the entire class in Distribution or Trend format.
Distribution
Select the Distribution tab to see how many students' average grade is in each grade band. Select any bar on the graph to view a list of students in that range. Select any student from the list to send them a message.

Trend
Select the Trend tab to view a graph of student performance on assignments over time. Hover over any datapoint for additional details about the assignment.
Rubrics
Target support by identifying students' performance in specific grading criteria across assignments with rubrics. Hover on any criteria bar to view the percentage of students performing at each level. If points were established in the rubric, you can also view the average grade for each criteria. Learn more about rubrics.

Student list
Get an at-a-glance view of how students in your class are performing and where they need support with the student list.