
Use Copilot in Excel to get insights and analysis of your Power BI reports. Based on your Power BI data, Copilot can answer questions about the data, create summaries for quick review, or insert editable tables, charts, and other Excel elements directly into your workbook.
Copilot responses are based on the Power BI report data, so results are traceable to the source report. By directly referencing a Power BI report, you ground your Copilot in Excel responses in data from your organization.
Add a Power BI report to your Copilot in Excel session
To analyze a Power BI report with Copilot in Excel, attach the report to a Copilot in Excel request and ask Copilot to review it.
- In the Copilot pane, select the + in the prompt field to open the Add work content menu, and then select Add work content.
- The search option in the work content menu may be automatically activated. Exit search.
- From the row of tabs, select More, and then select Other.
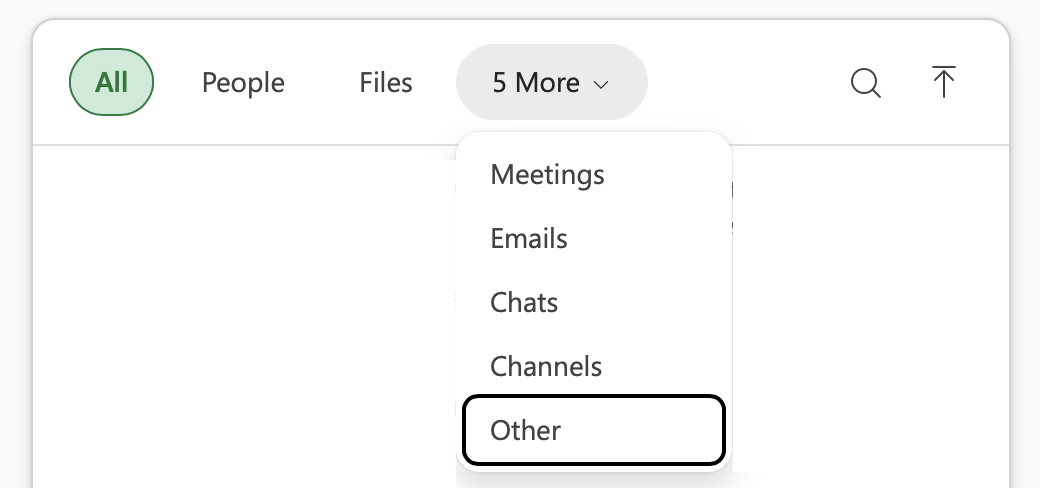
- A list of your recently accessed Power BI reports opens. Select a report to attach it to your Copilot in Excel chat.
- Enter your prompt text and send the request to Copilot.
Important
When you attach a Power BI report to a Copilot in Excel request, Copilot imports a one-time snapshot of the data. The result does not stay connected for automatic refresh. To reflect newer Power BI data, attach the report again and submit a new prompt.
Find the report you want to use
The Add work content > More > Other menu displays recently accessed Power BI reports automatically. If you have no recent report history, the list may be empty. Use the search field to locate reports you have permission to access.
Availability and admin controls
Power BI content in Add work content > More > Other is available only when your admin enables Fabric data in Microsoft 365 Copilot. If Other does not appear in your menu options, contact your IT admin.
For more information about allowing Power BI analysis with Copilot in Excel, see Use Power BI data in Microsoft 365 Copilot.
Tip
To ensure that Other displays in the menu options, your IT admin must enable Fabric data for Copilot in Excel by following the steps to Manage Fabric data in Microsoft 365 Copilot.
To ensure that recently accessed reports appear under Other, IT admins should follow the steps to Turn on Fabric data in Microsoft 365 Copilot.
Example prompts for Power BI report analysis
 Summarize the key metrics in this report and highlight the most important trends, changes, and outliers.
Analyze the funnel in this report. Where is the largest drop-off, and which stage should I investigate first?
Create an editable table showing the main metric over time, split by a relevant category. Add a chart and flag any notable changes.
Show the main metric by time period. For the strongest period, identify the top contributing categories.
Using the latest period available, rank the top contributors to the main total and show the results in a table.