
Last updated: August 2026
Transform your notebook content into rich, AI-generated visual narratives. Infographics help you turn documents, presentations, PDFs, meeting notes, web content, and research materials into visually engaging, grounded experiences that make complex information easier to understand, communicate, and share.
Infographics are generated using the content in your Copilot Notebook and are grounded in your notebook references, helping you explore insights, identify patterns, and communicate findings more effectively.
Note
Copilot Notebooks is available to Microsoft Copilot, Copilot Chat, Personal, Family, and Premium subscribers. Creating notebooks also requires an active SharePoint or OneDrive license. Infographics is available to both Microsoft Copilot and Copilot Chat licensed users. Learn more about Microsoft Copilot licensing, and Microsoft Copilot plans.
Infographics can help you
- Turn complex information into easy-to-understand visuals.
- Spot patterns, relationships, and key insights faster.
- Communicate findings more effectively with stakeholders.
- Move from content collection to understanding in seconds.
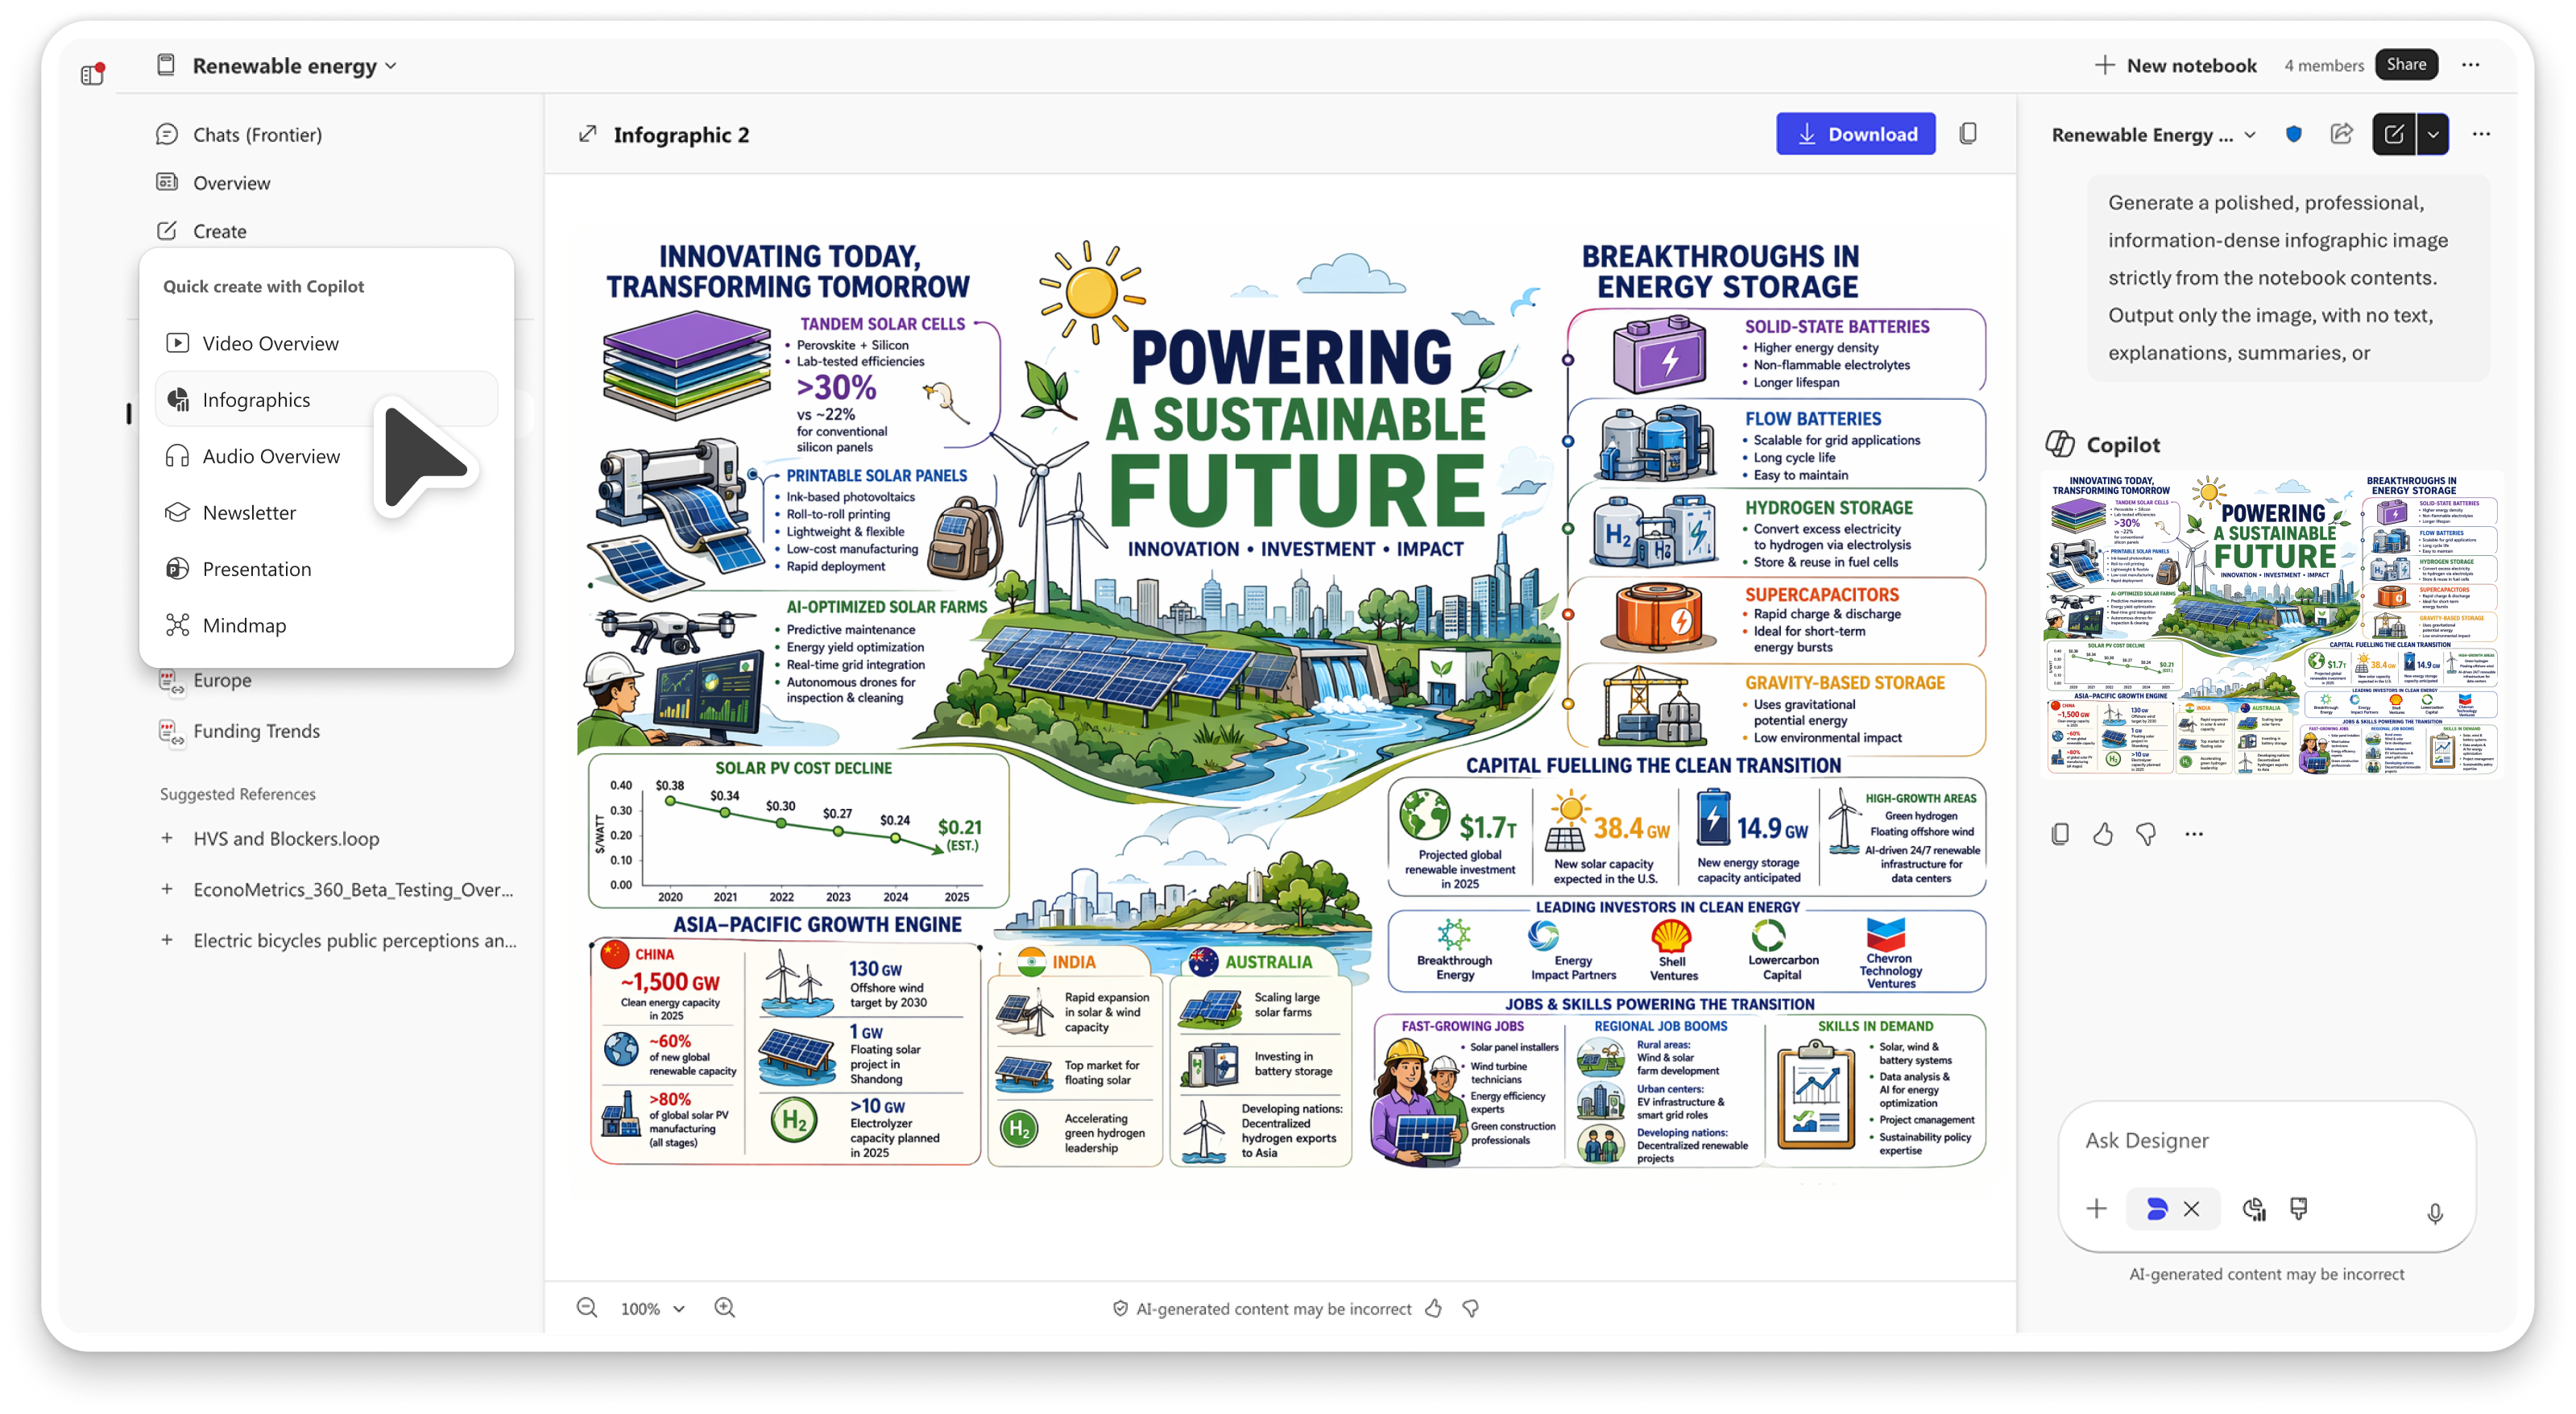
Create an infographic
Open an existing Copilot Notebook or create a new one in the Microsoft Copilot app or OneNote.
If new, add relevant content, such as documents, presentations, PDFs, meeting notes, web content, or research materials.
Select Create in the left pane, then choose Infographic.
Copilot generates an infographic based on your notebook content.
Copy or download the infographic to share it easily with others.
Share infographics across your work
Copy the infographic content for use in Teams messages, Outlook emails, newsletters, and documents.
Download the infographic as an image and add it to project detail pages, status reports, presentations, or leadership updates.
Share the visual with project teams, stakeholders, customers, or cross-functional partners to communicate insights more clearly.
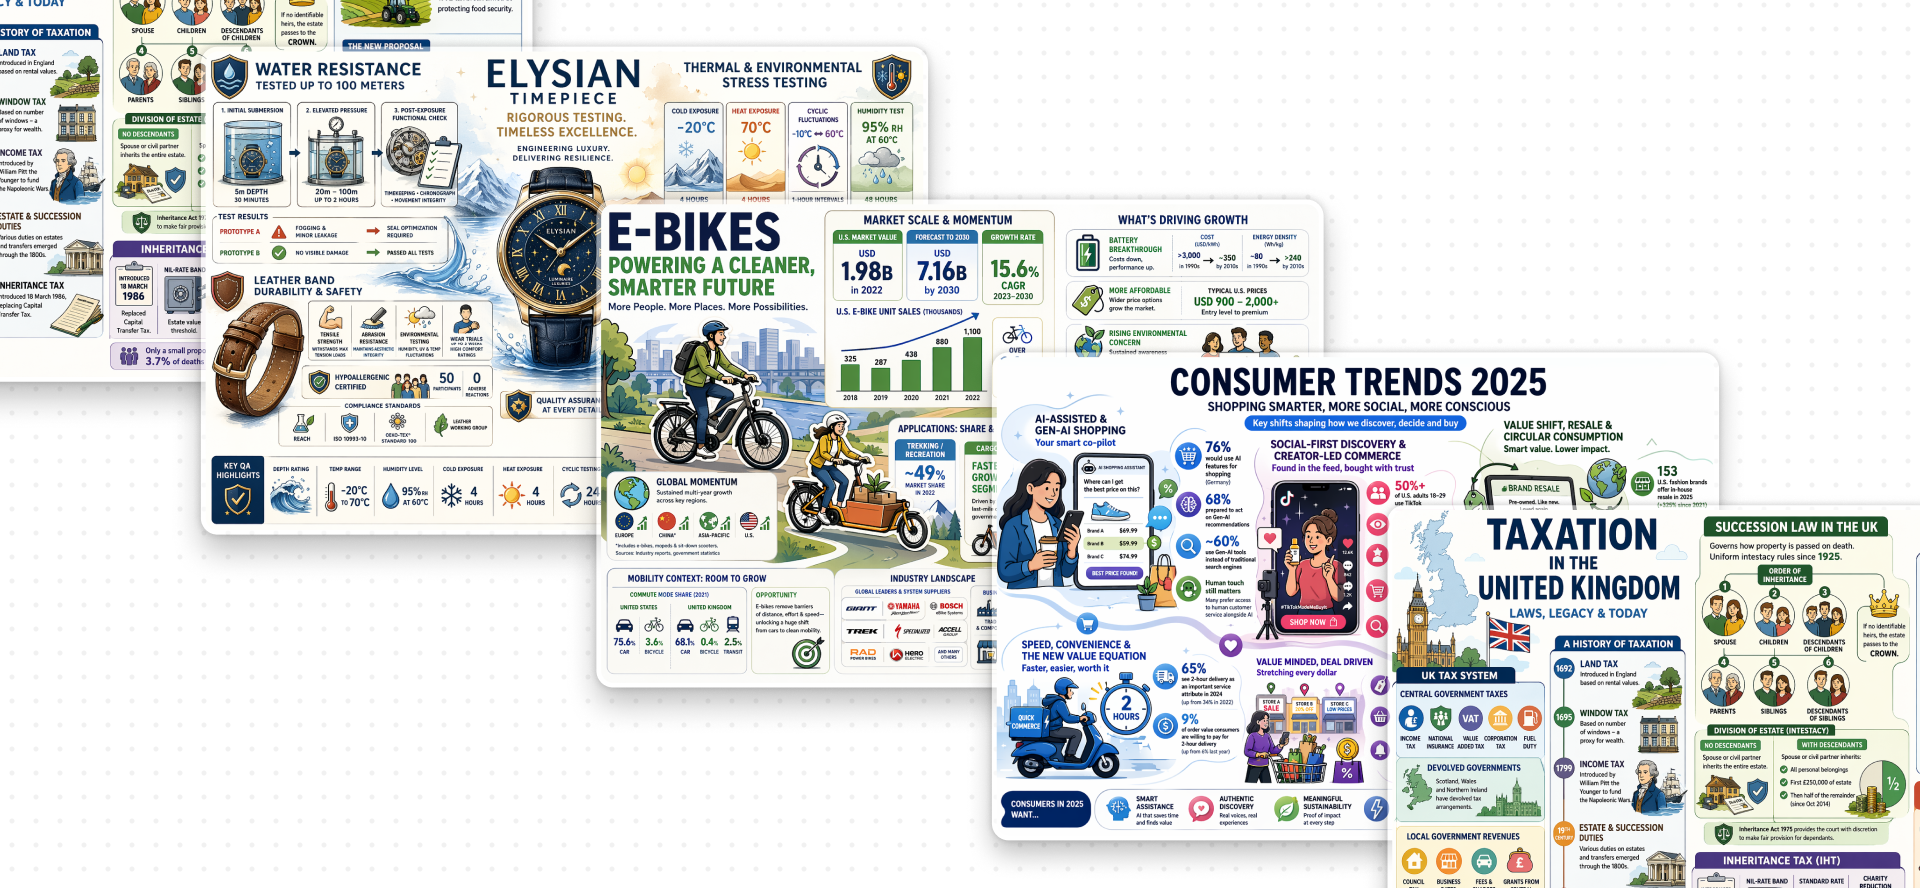
Scenarios users are bringing to life with infographics
Leadership updates - Turn strategy, project status, feature updates, and milestones into concise visuals for Teams and Outlook.
Project documentation - Summarize goals, architecture, dependencies, timelines, risks, decisions, and launch status for project detail documents.
Newsletters and stakeholder communications - Transform research findings, program updates, product highlights, and business results into engaging newsletter or email visuals.
Customer feedback analysis - Highlight recurring themes, pain points, sentiment, and feature requests to make insights easier to discuss.
Competitive and market research - Compare competitors and summarize market trends, strengths, weaknesses, and opportunities.
Launch readiness and business reviews - Bring together milestones, dependencies, risks, readiness, and key decisions in one visual summary.
Learning and research explainers - Simplify reports, research findings, meeting notes, and reference materials into reusable visual explainers.
Important limitations
Infographics are private to you, even when created from a shared notebook.
Infographics generation is available on desktop and web only in Copilot Notebooks in the Microsoft Copilot app and OneNote.
On Android and iOS OneNote and M365 apps, you can consume/preview the generated infographics.
Generated outputs reflect the content available in your notebook at the time of creation.
The quality and completeness of an infographic depend on the quality, and relevance of notebook sources.
Feedback
Use the thumbs-up or thumbs-down buttons available below the infographic to submit feedback. Your feedback helps improve future infographic experiences in Copilot Notebooks.
More ways to work with Copilot Notebooks
Get started with Microsoft Copilot Notebooks
Remove a reference from your Microsoft Copilot Notebook
Provide custom instructions for your Microsoft Copilot Notebook