
All-classes view in the Insights app
View Your classes in the Insights app for actionable data views across the classes you teach. Details about assignments, activity levels per day, missed meetings, and more can let you know which classes you might want to focus on.
Add the app
-
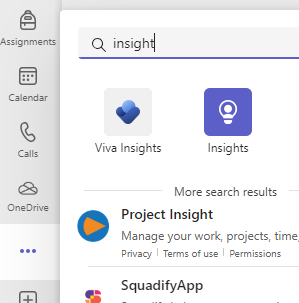
Select ... to find More added apps.
-
Search for Insights in the search bar and select it.
-
Select Save.
-
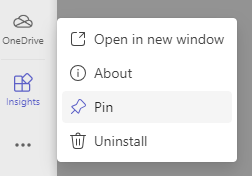
Pin Insights to your app bar by right-clicking on the app icon and selecting Pin.
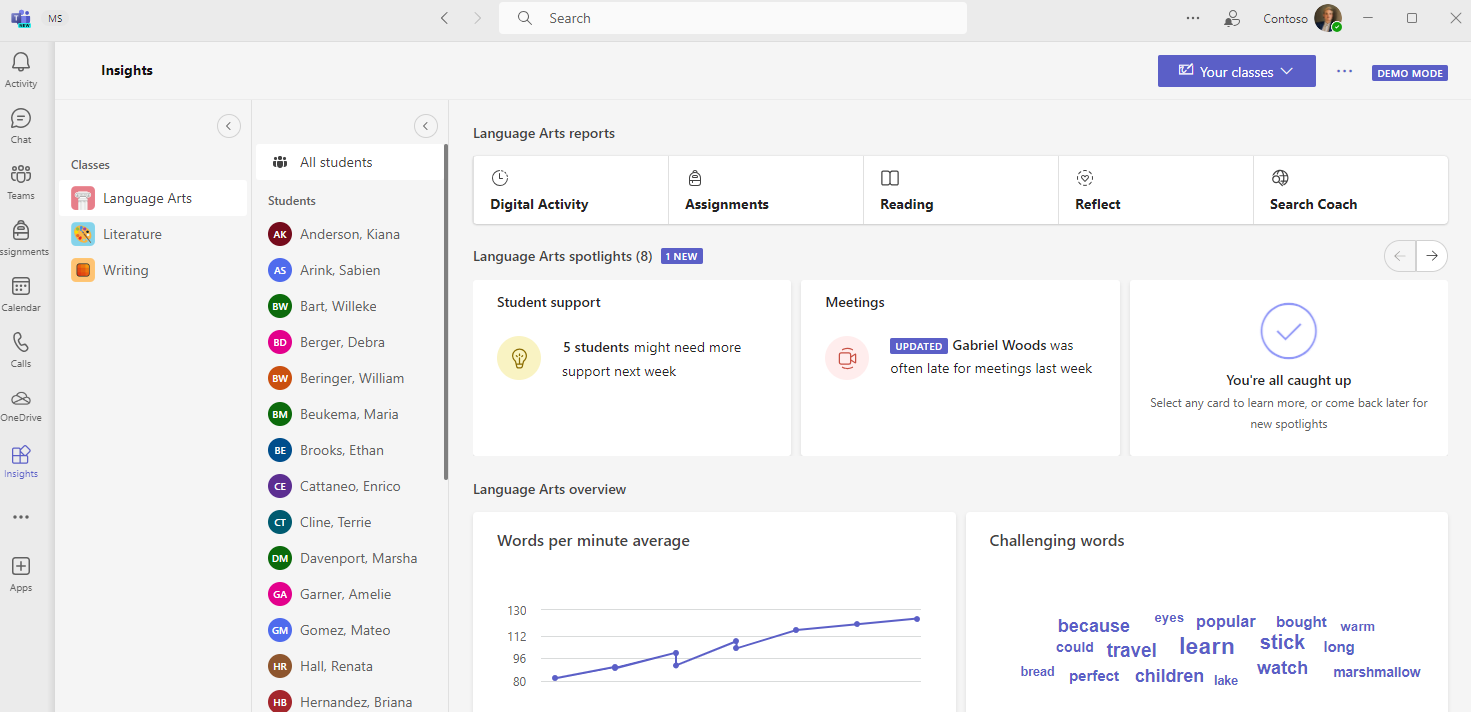
Read your data across classes
To access Your classes view, select the Insights app from your Teams app bar.
You'll see spotlight cards, followed by data about student activity, meeting absences, Reflect, and missed assignments for all the classes you own.
-
Select any datapoint for more details, or select a class name to see complete data for that class.
-
By default, classes are sorted alphabetically. To prioritize classes by data (for example, which class has the most absences), select

-
The number of students in each class is indicated next to the class name.
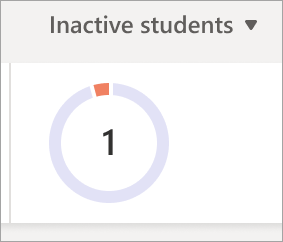
Inactive students
This number and graph shows how many students were not active in this class.
-
Hover over the pie to see who was inactive and for how many days during the timeframe.
-
Select the pie to open the digital activity report and see more details.
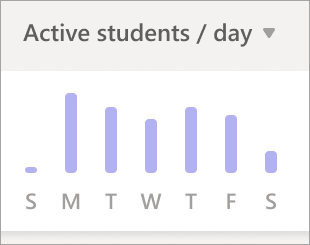
Active students per day
This metric is measured by various student engagements, include their meeting attendance, Reflect responses, frequency of post creation/replies, reactions in the team, file opening/editing, OneNote usage, and assignment submissions.
-
Hover over the graph to see how many students were active each day.
-
Select the graph to open the digital activity report and filter by type of activity.
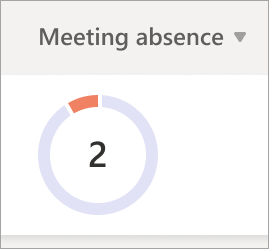
Meeting absence
A student is considered to have missed a meeting if they didn’t attend at all, or only for a short time (either less than 50% of the meeting or less than 30 minutes, whichever comes first).
-
Hover over the pie graph to see a list of students and how many meetings they missed during the time frame.
-
Select the pie graph to open the digital activity report.
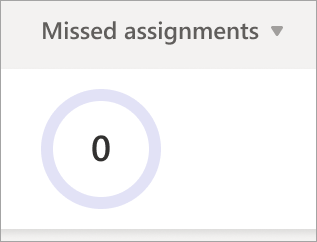
Missed assignments
This pie graph shows how many students didn't turn in at least one assignment that was due during the selected time frame.
-
Hover over the pie graph to see a list of the students who missed assignments (and how many assignments).
-
Select the pie graph to open the assignments and grades report.
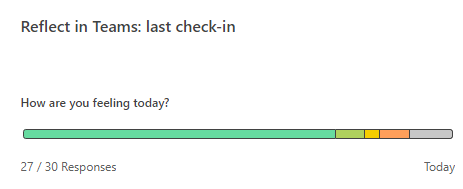
Reflect
This chart correlates with which emojis students used to describe their emotions during the selected time frame.
-
Hover over the bar graph to see the percentage of responses for each emoji.
-
Gray indicates students didn't respond.
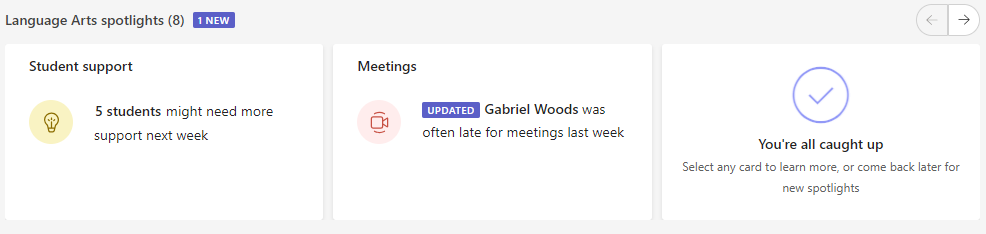
Spotlights
Spotlights shed light on actionable pieces of class data.
-
Hover over bolded text showing a number of students to see individual names.
-
Learn to read your Spotlights, including color coding and label meanings.
Learn more


Need more help?
Want more options?
Explore subscription benefits, browse training courses, learn how to secure your device, and more.


Communities help you ask and answer questions, give feedback, and hear from experts with rich knowledge.


