
Explorer screen elements
The Explorer screen is the default landing page in PowerScribe One. It is the primary workspace for accessing worklists, managing report queues, and locating orders and reports. The sections below describe the key components of the Explorer screen.
Navigation tools
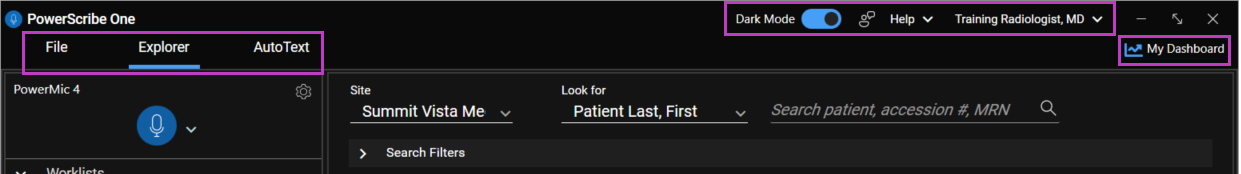
Use the navigation area to move through the application, manage dictation, and access personalization and support options.
- Use the File menu and screen navigation to access high‑level application actions and move between key areas of PowerScribe One.
- Use the Color Theme toggle, User Feedback, Help, and User menus to customize the interface, submit in‑app feedback, and access help resources.
- Select My Dashboard to view personalized workload information and productivity insights.
Accessing Worklists and the Speech Menu
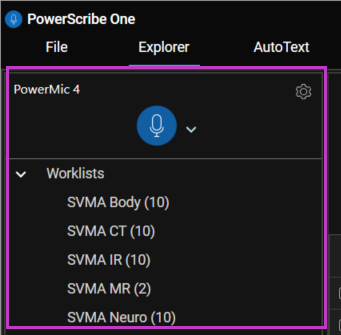
- From the Navigator pane, start or stop dictation, view the current dictation status, select a recording device, and open the PowerScribe One Speech Menu (gear icon) to access voice commands, formatting options, and speech‑related settings.
- Use Worklists to quickly access collections of exams organized by workflow needs. From your assigned worklists, you can browse reports, apply filters, and open reports directly for review or dictation.
Searching for reports using quick search and filters
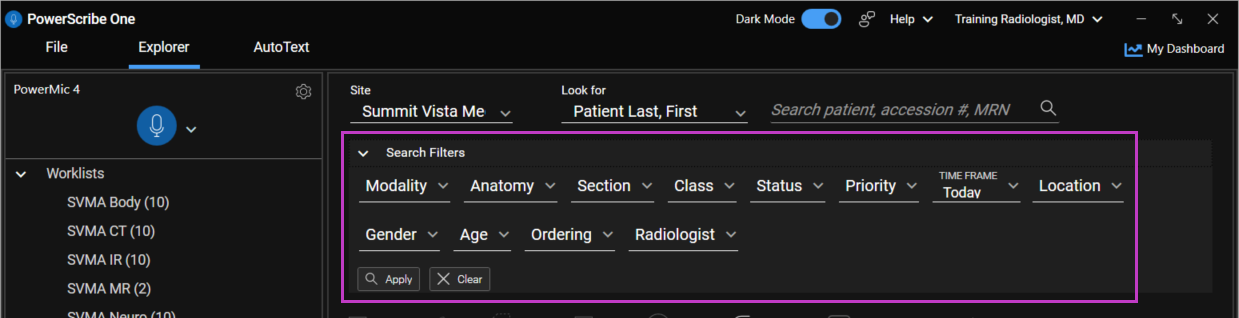
Quick search, combined with search filters, helps narrow results in the Explorer screen to quickly identify reports that align with specific workflow requirements.
- Use Site to limit your search to a specific site. Selecting a site enables additional filters relevant to that location.
- Use Look for and Search text field to search by accession number, patient name, or MRN. This allows you to quickly locate a specific order or report.
- Use Search Filters to narrow the results based on workflow requirements such as status, modality, priority, time frame, or other available criteria. Multiple filters can be applied together to refine the results list.
- Select Apply to display matching results in the results grid or select Clear All to reset the filters and start a new search.
For more information, see Search for a report.
Queues, action buttons and the results grid
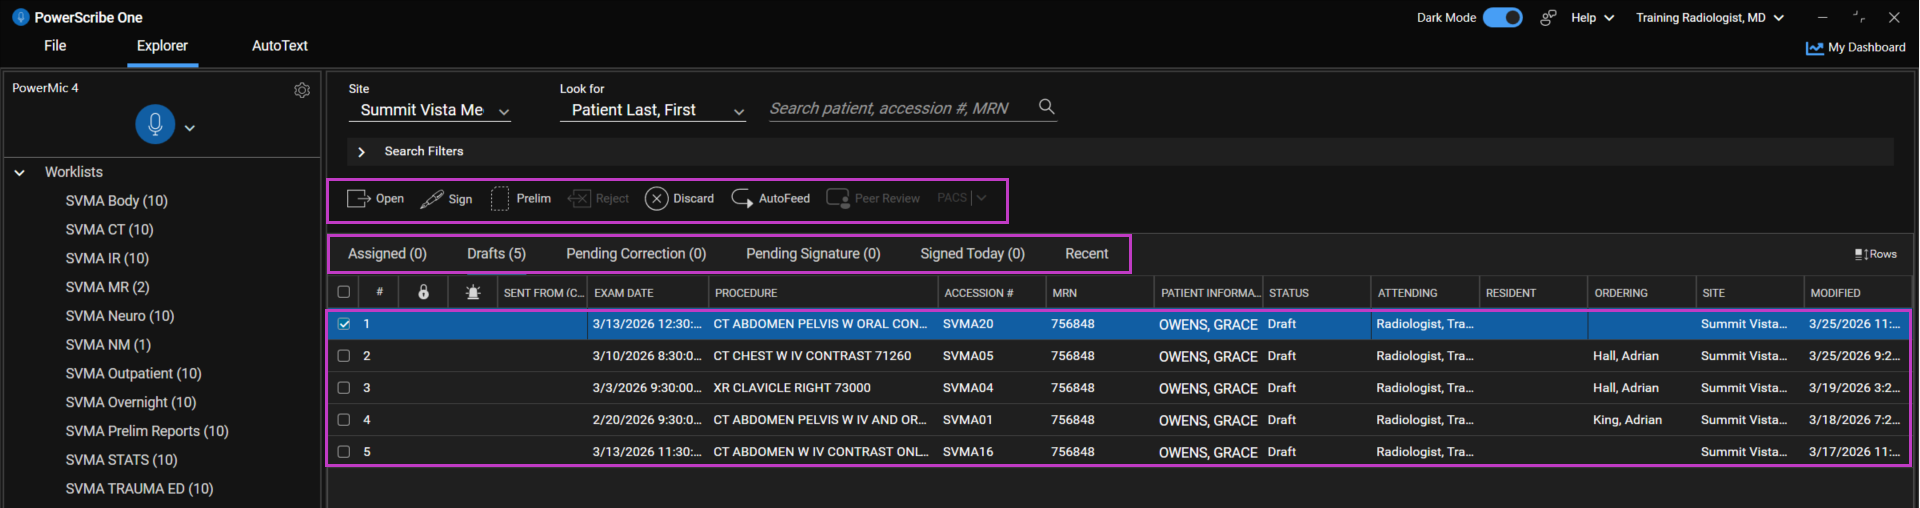
The Explorer screen provides multiple tools to help organize, act on, and prioritize reports efficiently.
- Reporting queues present system‑generated or user‑assigned lists of reports based on workflow status, enabling you to quickly identify and prioritize work. For more information, see Use the Reporting Queues.
- Action buttons allow users to perform common report actions on selected reports, including Open, Sign, Prelim, Reject, Discard, enable Autofeed, Peer Review or launch PACS when configured.
- Result columns and the results grid display the reports that match the selected queue or search criteria. The results grid shows key exam details and supports customization to suit your workflow preferences.
Customize the results grid
- In the results grid, right‑click any column header and select Add/Remove Columns.
- Select the columns you want to display.
- Use the Move Up and Move Down buttons to reorder the columns as needed.
- Select OK to apply your changes.
Customizing the results grid allows you to tailor the view to highlight the information most relevant to your reporting workflow.
Using the Bottom pane and Status bar
As you review or dictate reports, these sections in the Explorer screen provide immediate access to report details and system status, helping you work efficiently and with confidence.
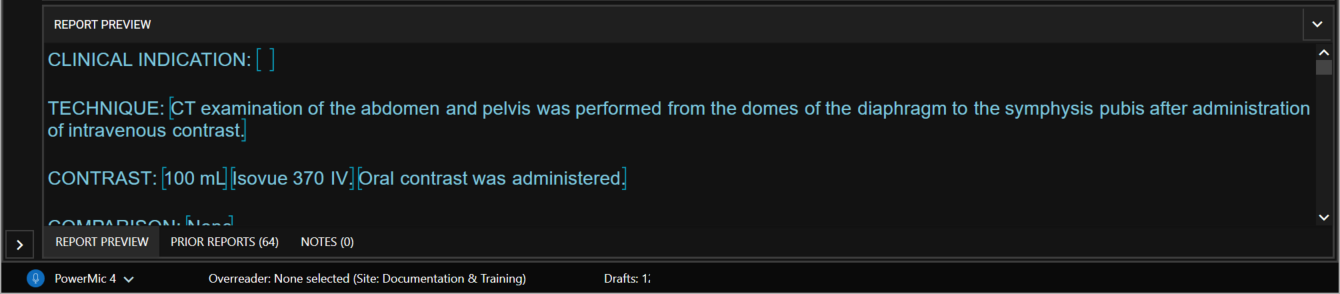
- Bottom pane provides quick access to Report Preview for the selected report, Prior Reports for the same patient, and Notes attached to the report or patient. These views support informed decision‑making while reviewing or dictating reports.
- Status bar displays the currently connected recording device and the number of draft reports, helping users confirm system readiness and monitor active work.