
mPower Analytics is an easy-to-use tool that helps you understand practice productivity and clinical trends. It provides ready-to-use dashboards for common insights and custom graphs when you want to explore data in more detail.
Use mPower Analytics to review volume, turnaround times, quality events, and other performance metrics within mPower.
Access mPower Analytics
To start analyzing data:
- Sign in to mPower.
- From the main page, select mPower Analytics.
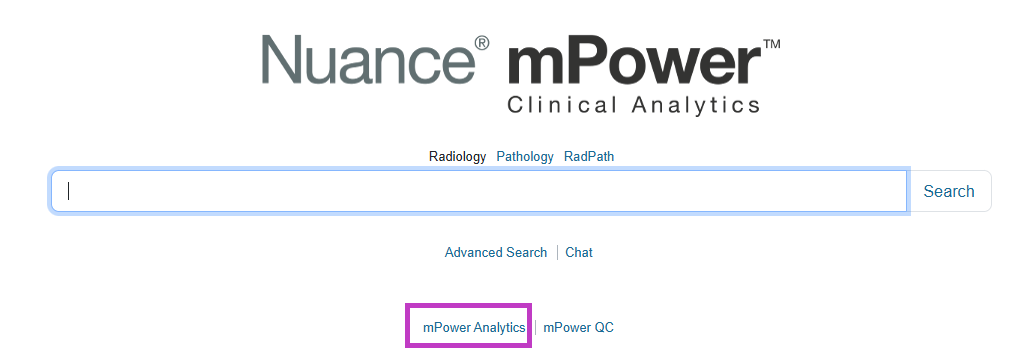
The Analytics window opens with two main areas:
- Custom Graph, where you create your own analytics views.
- Dashboards, which provide prebuilt summaries of key metrics.
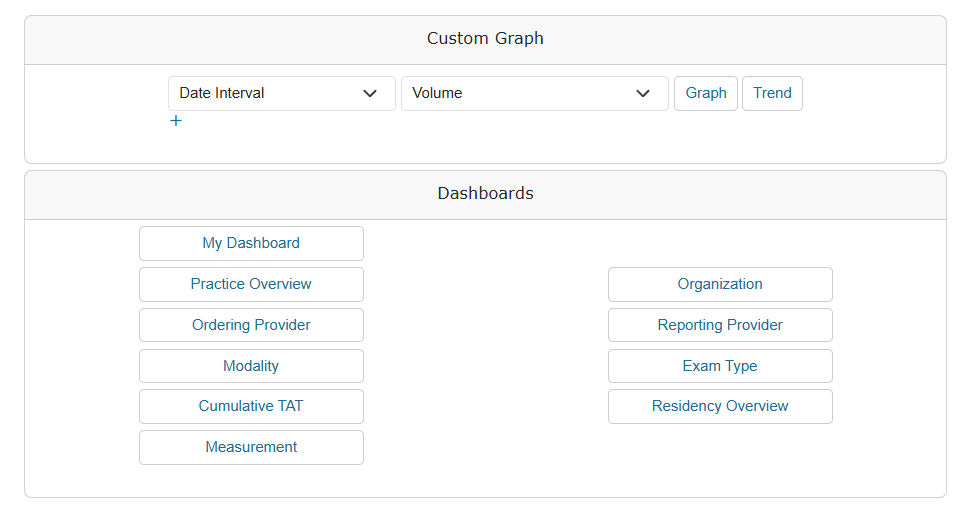
Begin with these topics to learn about mPower Analytics
Create custom graphs by selecting concepts, measurements, and filters. Explore productivity, turnaround times, and quality trends in mPower Analytics.
Export analytics results to Excel or CSV. Review filtered data, recreate graphs, or continue analysis outside mPower.
Share analytics using permalinks
Create permalinks to save or share analytics views. Quickly reopen the same graph with all filters applied.
Use prebuilt dashboards to quickly review common metrics like volume, turnaround time, and quality events without creating custom graphs.
Next up: Review quality and performance with mPower QC
Review quality and performance with mPower QC to track critical results, follow-ups, mismatches, and quality measures. This tool supports safer, more accurate clinical workflows. Let's go
Explore more
Already using mPower? Explore More Help to quickly find what you need and start learning today.