
The Measurement Finding dashboard in mPower Analytics helps you analyze extracted clinical measurements from reports, such as nodules or lesions. It provides a visual way to track measurement trends and review related reports.
What the Measurement Finding Dashboard shows
The Measurement Finding Dashboard displays analytics based on measurements identified in reports using natural language understanding (NLU). Depending on your configuration and permissions, it might show:
- Counts of reports containing measurements
- Measurement types and categories
- Changes in measurement values over time
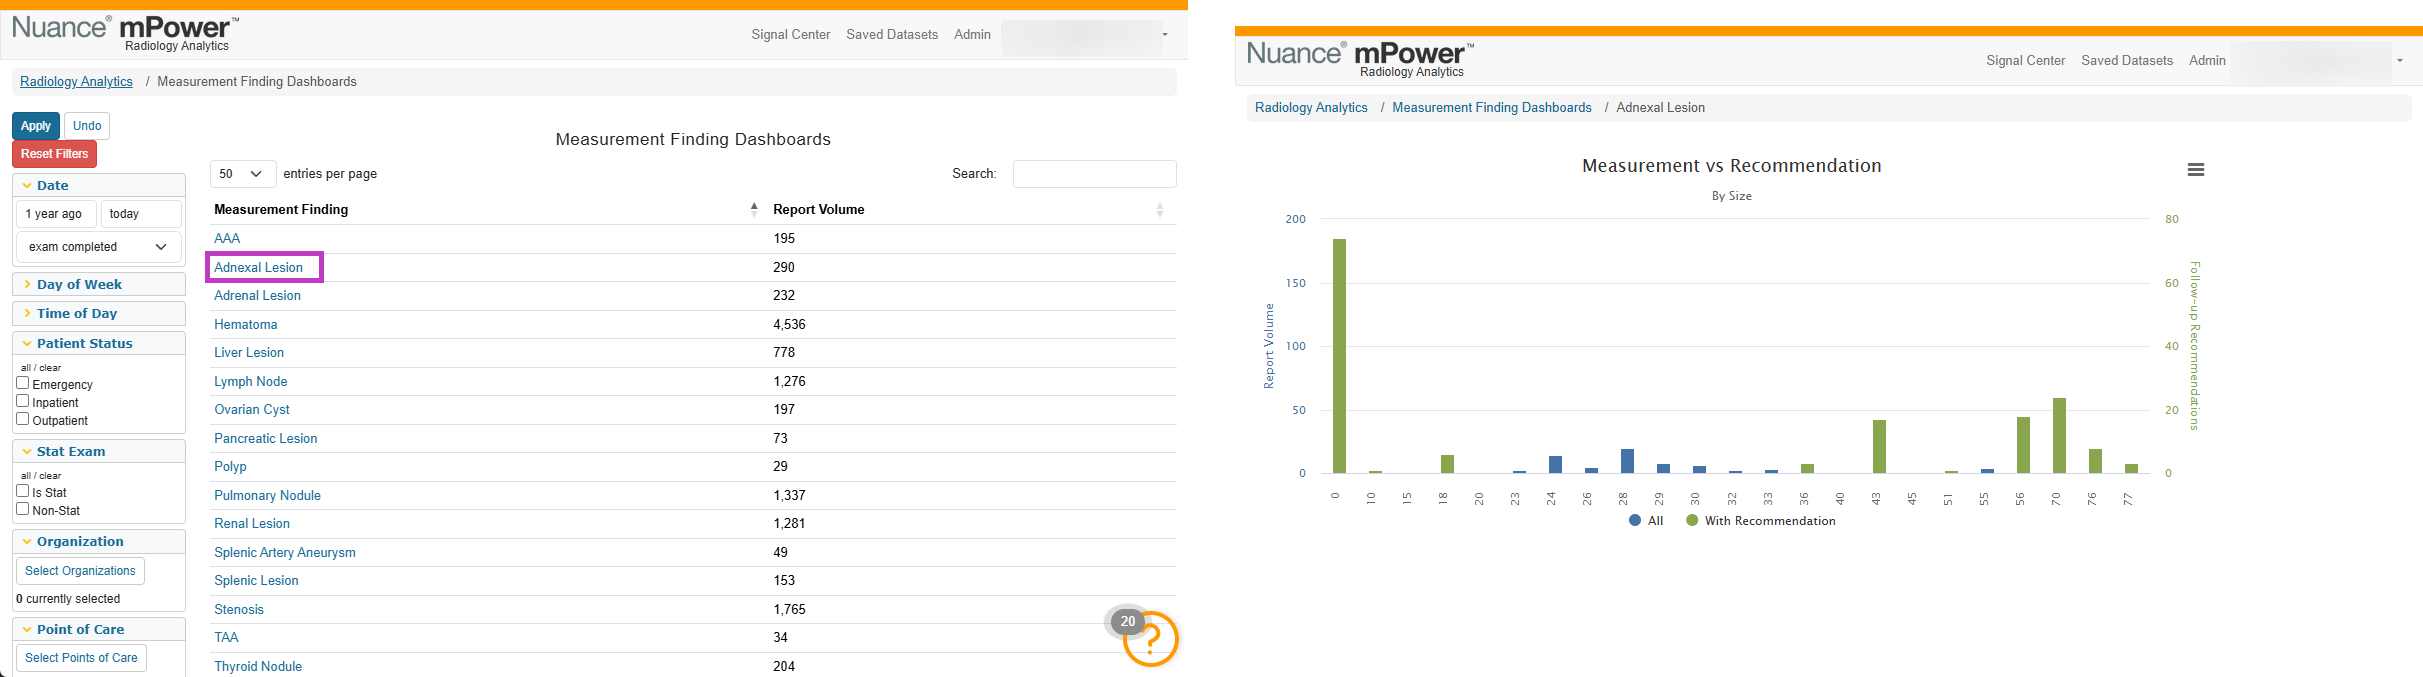
- Distribution of measurements by size or range
- Follow-up recommendations
This dashboard helps you understand how measurements are documented across reports.
Open the Measurement Finding Dashboard
To access the Dashboard:
Sign in to mPower.
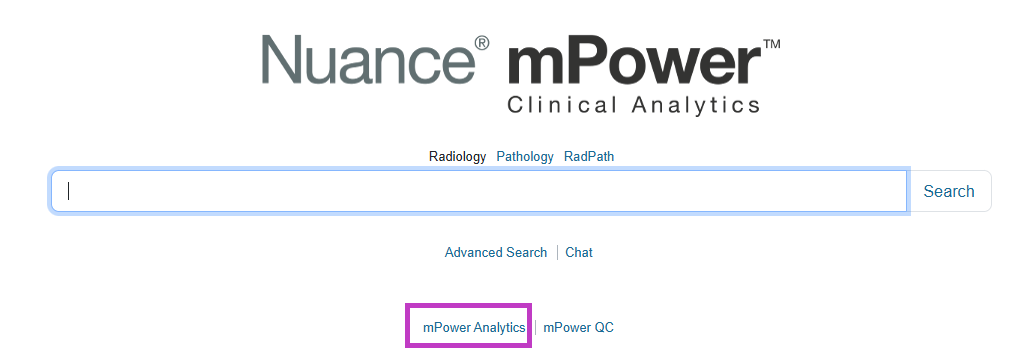
Select mPower Analytics from the main page.
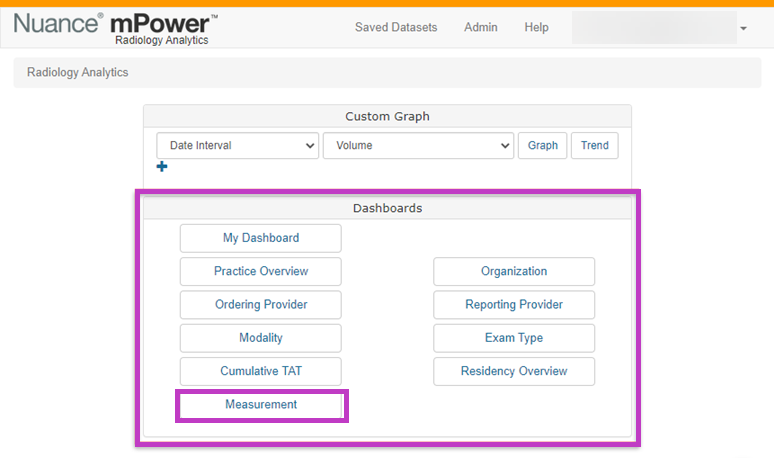
Open Dashboards.
Select Measurement.
The dashboard loads with charts summarizing available measurement data.
Next up: Review the Organization Dashboard in mPower
View performance metrics by organization to compare volume, turnaround times, and activity across sites or groups. Let's go