
Standard dashboards are prebuilt collections of charts and graphs that summarize key data such as productivity, quality events, and follow‑up activity. They use the same analytics data as Custom Graphs, but are already configured for common use cases.
Use standard dashboards to:
- Monitor productivity and turnaround times.
- Track quality-related events such as mismatches or critical results.
- Identify trends that might need further investigation.
Dashboards are especially useful for repeat reviews, daily checks, or preparing for discussions with your team.
Access standard dashboards
To open standard dashboards:
Sign in to mPower.
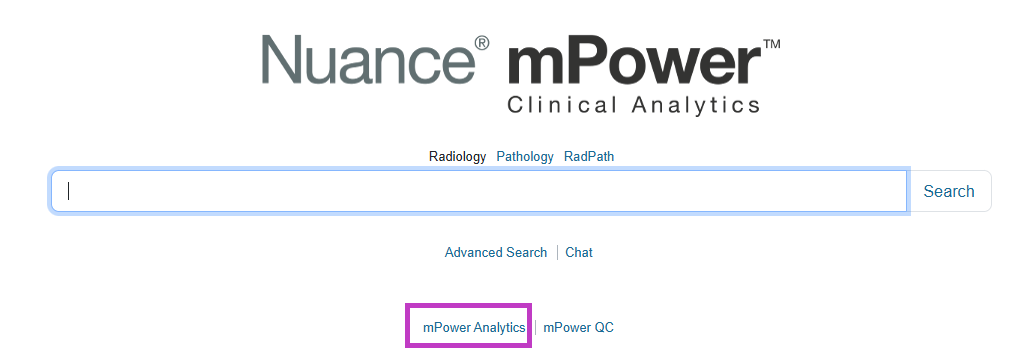
Select mPower Analytics from the main page.
In the Analytics window, select Dashboards.
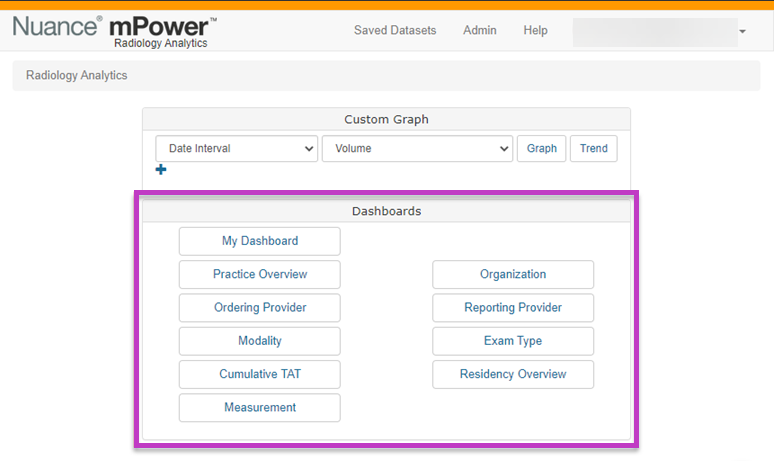
The dashboard view opens with available dashboards displayed as selectable options.
Navigate within a dashboard
Each dashboard contains multiple charts that present related metrics together. Within a dashboard, you can:
- View summary trends at a glance
- Hover over charts to see details
- Select chart elements to drill down into the underlying reports
This interaction workflow lets you move from high‑level insights to detailed report review without leaving mPower.
Drill into reports from dashboards
Many dashboard charts allow you to drill down:
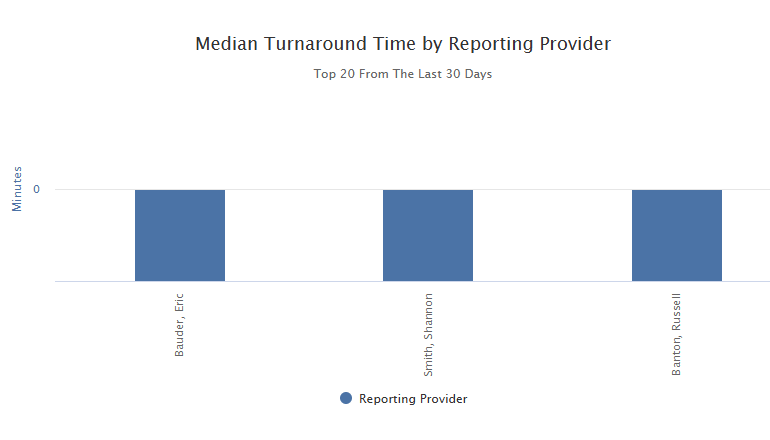
Select a data point or bar to open a list of related reports.
Open individual reports to review details.
 ---
---
This feature makes dashboards a starting point for deeper analysis when you spot unexpected trends or issues.
Start with these commonly used dashboards
View personalized analytics showing your volume, RVUs, turnaround times, and quality events to better understand your own performance.
Get a high‑level view of practice productivity, volume, turnaround times, and key quality indicators to monitor overall performance trends.
Review exam volume and activity by ordering provider to understand referral patterns and support operational decision‑making.
Analyze exam volume and turnaround times by modality to identify workflow trends and performance differences.
Track cumulative turnaround time trends over time to monitor efficiency and identify opportunities for improvement.
Explore extracted clinical measurements and trends, then drill into reports to support follow‑up and measurement‑based analysis.
View performance metrics by organization to compare volume, turnaround times, and activity across sites or groups. Reporting Provider dashboard
Analyze workload, turnaround times, and quality events by reporting provider to support productivity and performance review.
Review exam volumes and trends by exam type to understand demand patterns and workflow distribution.
Monitor resident exam volume, turnaround times, and activity patterns to support training and supervision needs.
Tip
When to use dashboards vs. custom graphs
- Use standard dashboards for quick, consistent views of common metrics.
- Use Custom Graphs when you need to answer specific questions or apply detailed filters.
Next up: Review quality and performance with mPower QC
Use mPower QC to review quality and performance trends, monitor key events, and identify issues that may impact clinical and operational outcomes. Let's go
Explore more
Already using mPower? Explore More Help to quickly find what you need and start learning today.