
My Dashboard in mPower Analytics provides a personalized view of performance and quality metrics based on your user profile. It helps you quickly understand your activity without creating custom graphs.
What My Dashboard shows
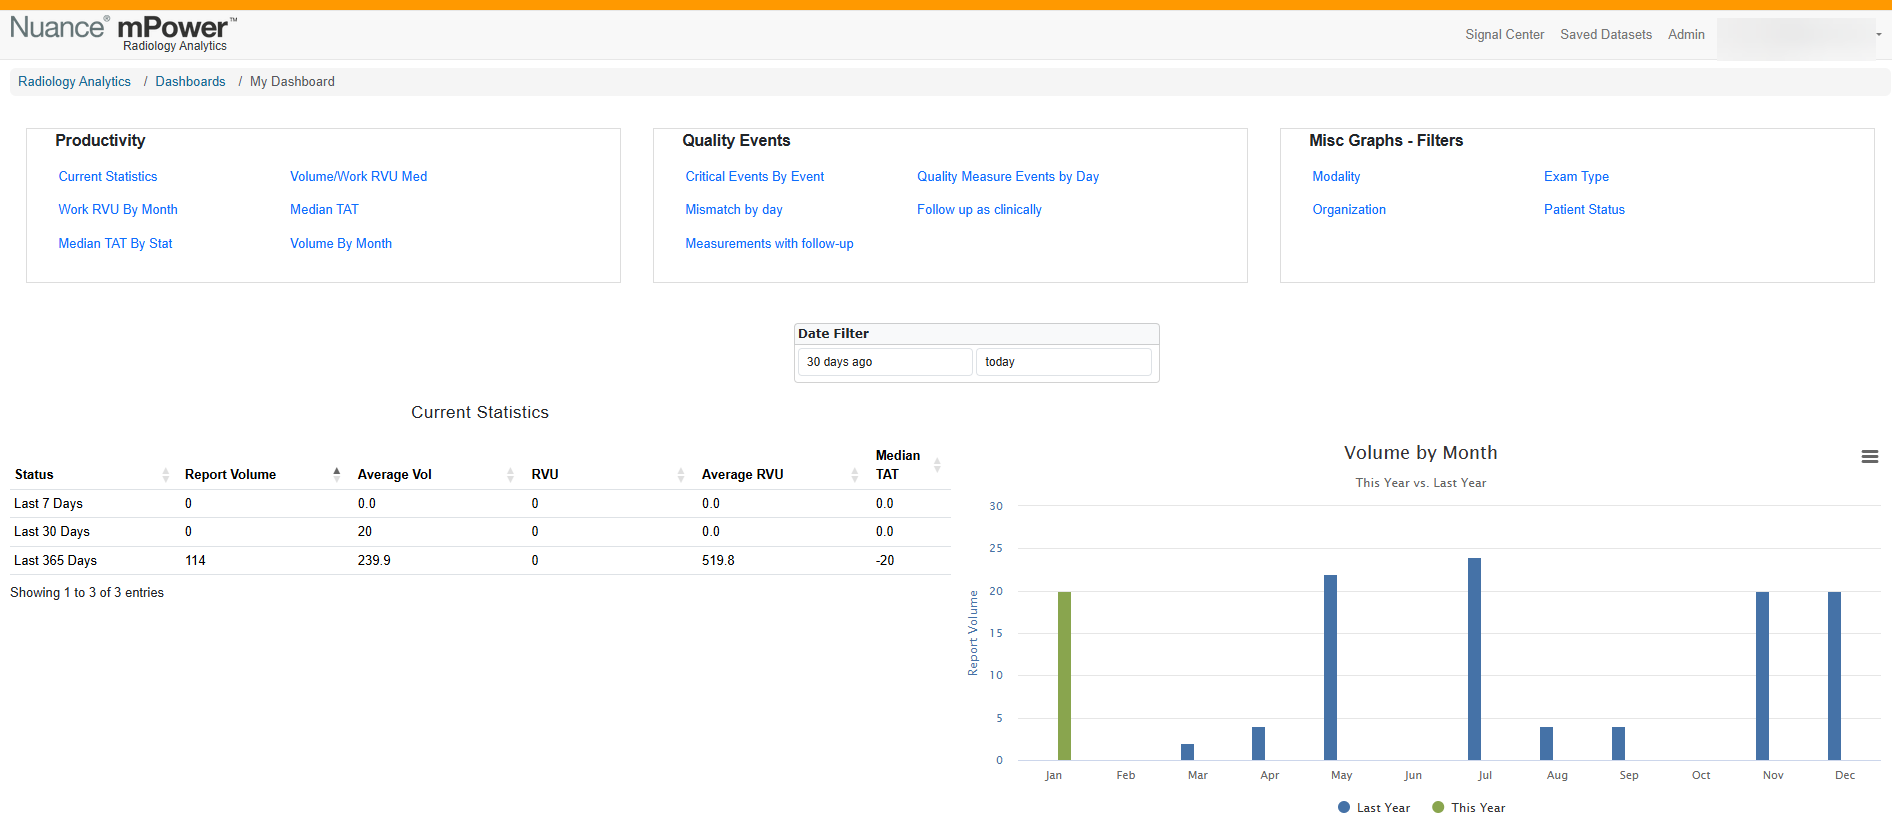
My Dashboard displays analytics relevant to you as a reporting provider or user. Depending on your permissions and configuration, it might include:
- Exam volume and activity trends
- Median turnaround times
- RVUs and productivity indicators
- Critical results and mismatches
- Quality measure and follow-up events
These metrics give you a quick summary of your performance at a glance.
Open My Dashboard
To access My Dashboard:
Sign in to mPower.
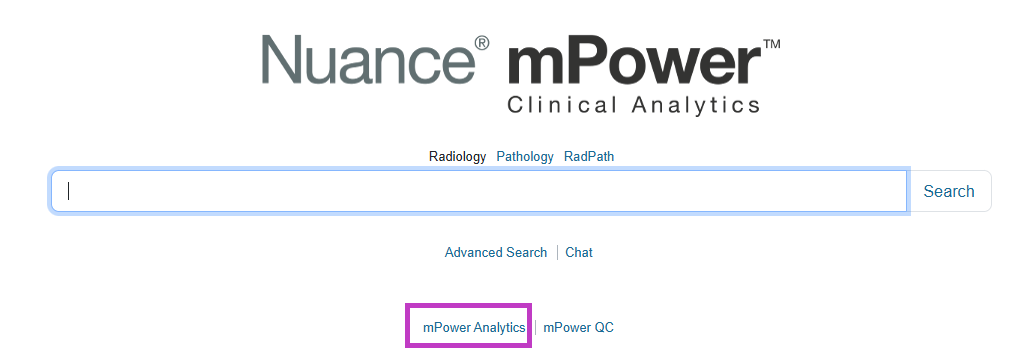
Select mPower Analytics from the main page.
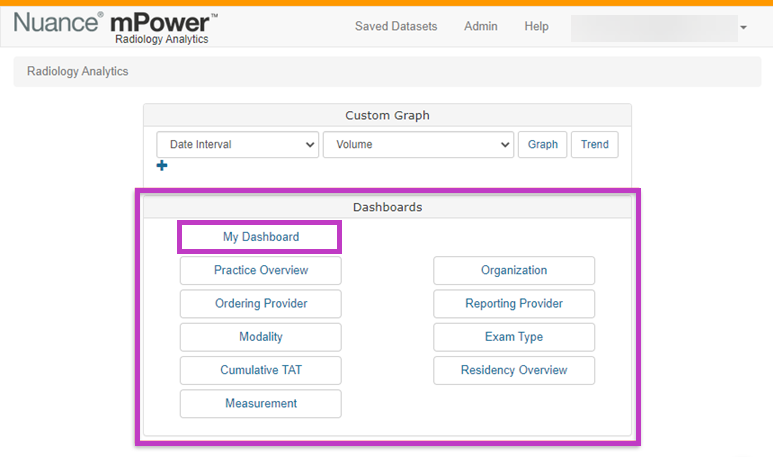
Open Dashboards.
Select My Dashboard.
If you don't see My Dashboard, your role or permissions might not support it.
Tip
- My Dashboard is for radiologists only. Administrators do not need this feature since they don’t dictate reports.
- My Dashboard requires that the Can View Own Analytics permission is enabled. (Ask your mPower administrator to do this.)
- An mPower administrator must associate your mPower user account with a Provider under mPower Admin > Providers Edit.
Next up: Review the Practice Overview dashboard
Get a high‑level view of practice productivity, volume, turnaround times, and key quality indicators to monitor overall performance trends. Let's go