
The Modality Dashboard in mPower Analytics helps you understand performance and workload by imaging modality. It provides visual insights into exam volume, turnaround times, and productivity trends so you can compare how different modalities are performing.
What the Modality Dashboard shows
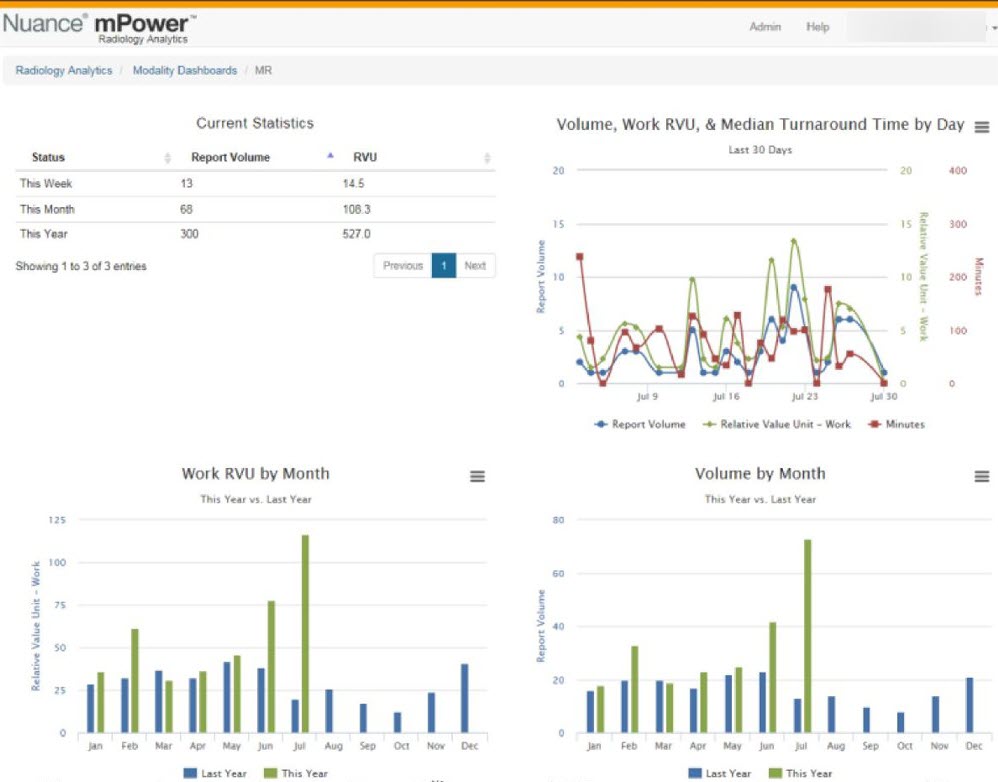
The Modality Dashboard displays analytics for a selected imaging modality (such as CT, MR, US, or CR). Depending on your data and permissions, it includes:
- Current statistics for the selected modality
- Exam volume, work RVUs, and median turnaround time by day (last 30 days)
- Monthly volume and work RVU trends (this year vs. last year)
- Median turnaround time by patient status
- Median turnaround time for stat vs. non‑stat exams
- Patient status distribution
- Activity by organization
These views help you quickly assess modality‑specific workload and performance trends.
Open the Modality Dashboard
To access the Modality Dashboard:
Sign in to mPower.
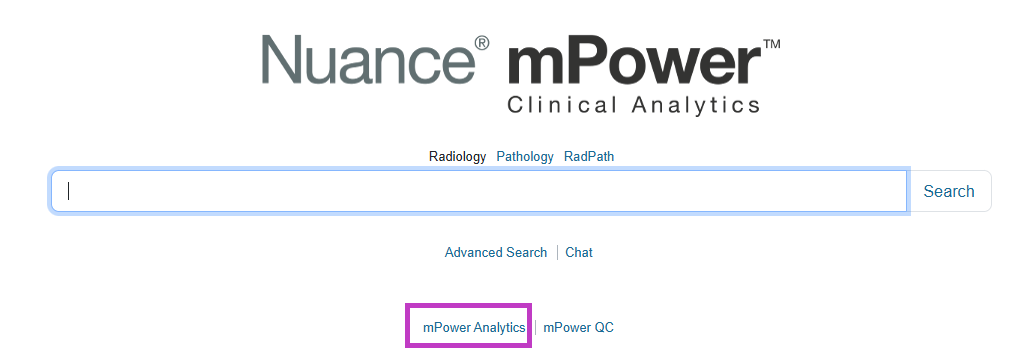
Select mPower Analytics from the main page.
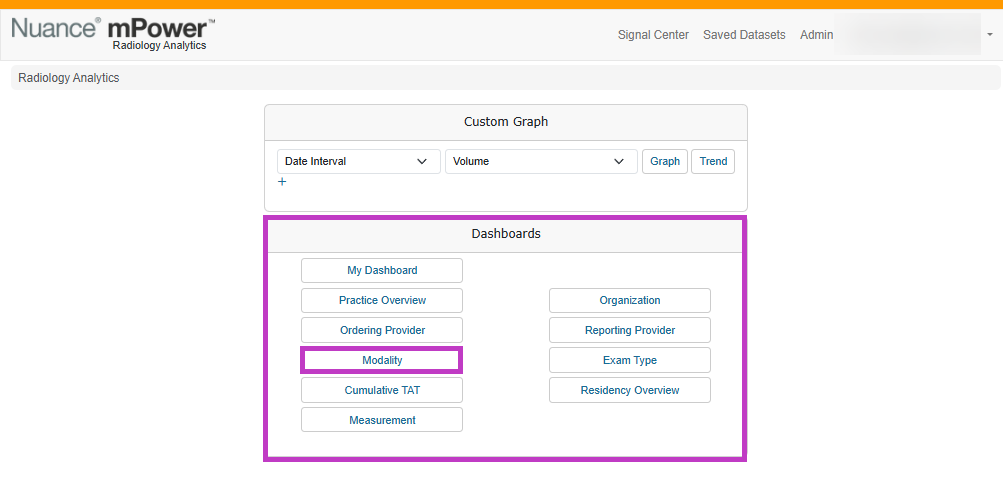
Open Dashboards.
Select Modality.
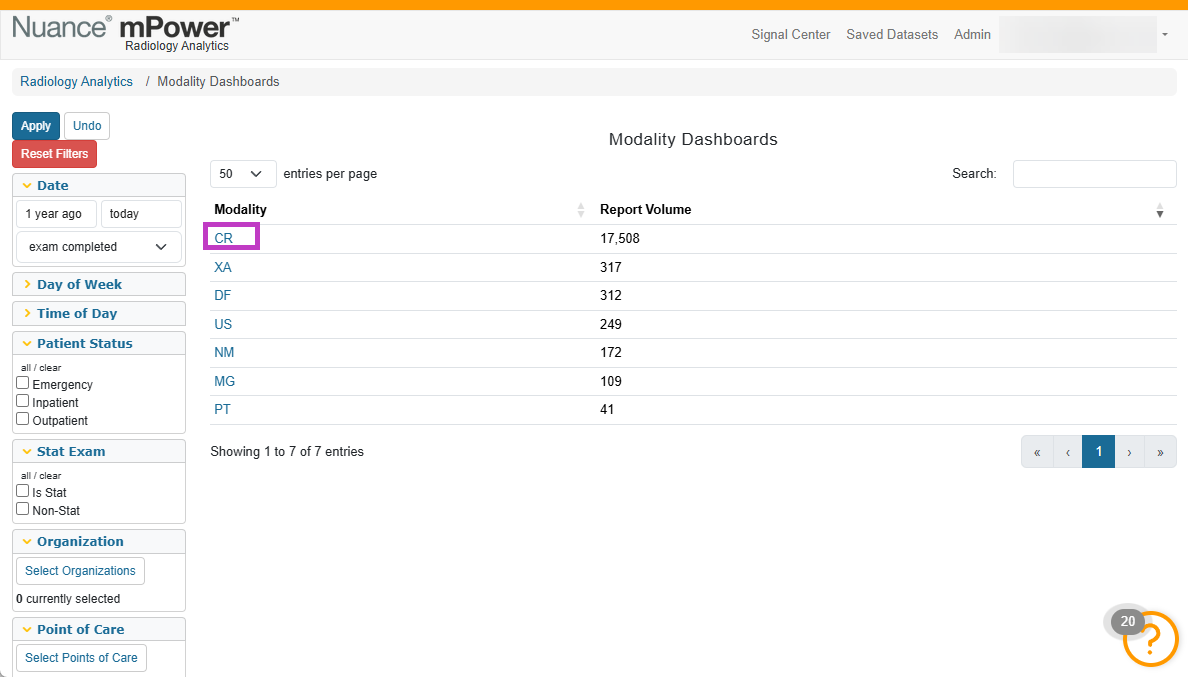
Choose a modality from the list to view its dashboard.
The dashboard opens with charts and tables specific to the selected modality.
Next up: Review the Cumulative TAT Dashboard in mPower
Track cumulative turnaround time trends over time to monitor efficiency and identify opportunities for improvement. Let's go.