
The Organization Dashboard in mPower Analytics helps you review performance and activity by organization or site. It provides visual insights into exam volume, turnaround times, and productivity so you can compare trends across locations.
What the Organization Dashboard shows
The following information appears in the Organization dashboard:
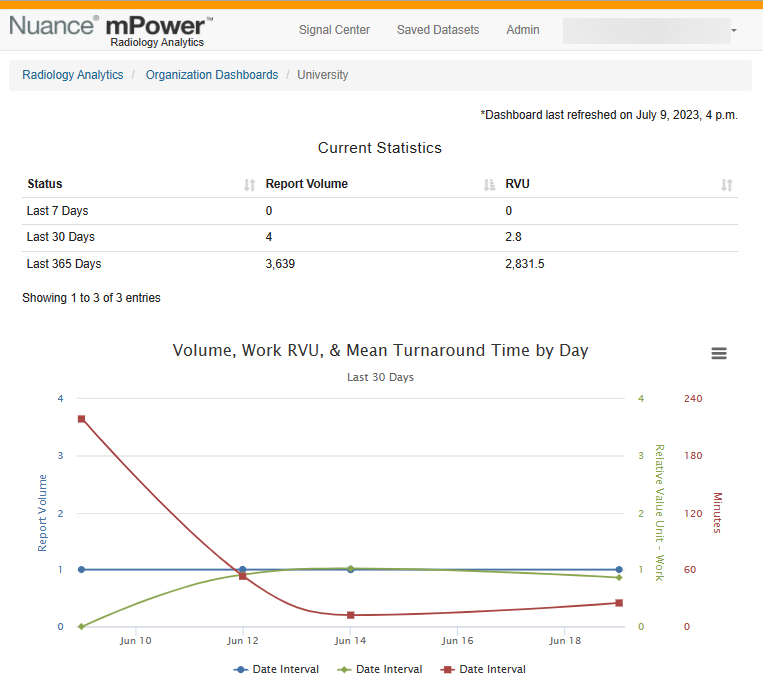
- Current Statistics
- Volume, Work RVU, & Mean Turnaround Time by Day (Last 30 days)
- Work RVU by Month (This year v. last year)
- Volume by Month (This year v. last year)
- Mean Turnaround Time by Patient Status (Last 30 days)
- Mean Turnaround Time by Stat v. Non-Stat (Last 30 days)
- Patient Status (Last 30 days)
- Exam Codes (Top 20 from the last 30 days)
Open the Organization Dashboard
To access the Organization Dashboard:
Sign in to mPower.
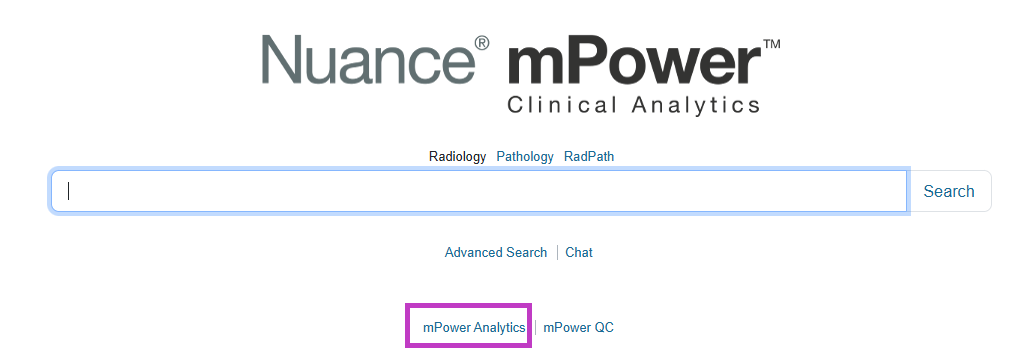
Select mPower Analytics from the main page.
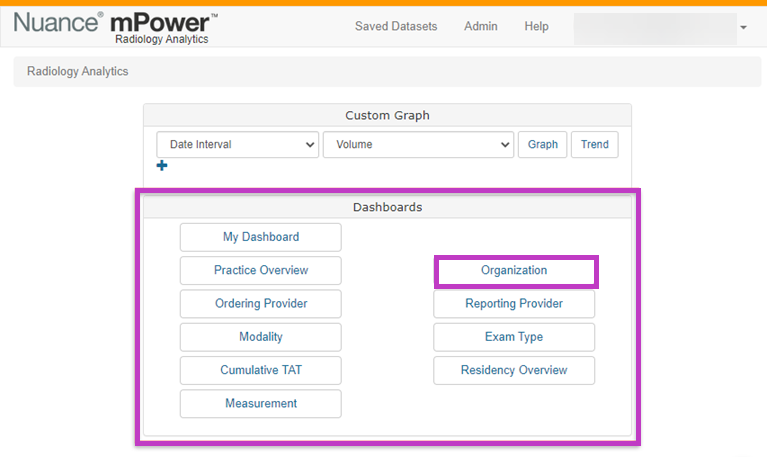
Open Dashboards.
Select Organization.Add your content here.
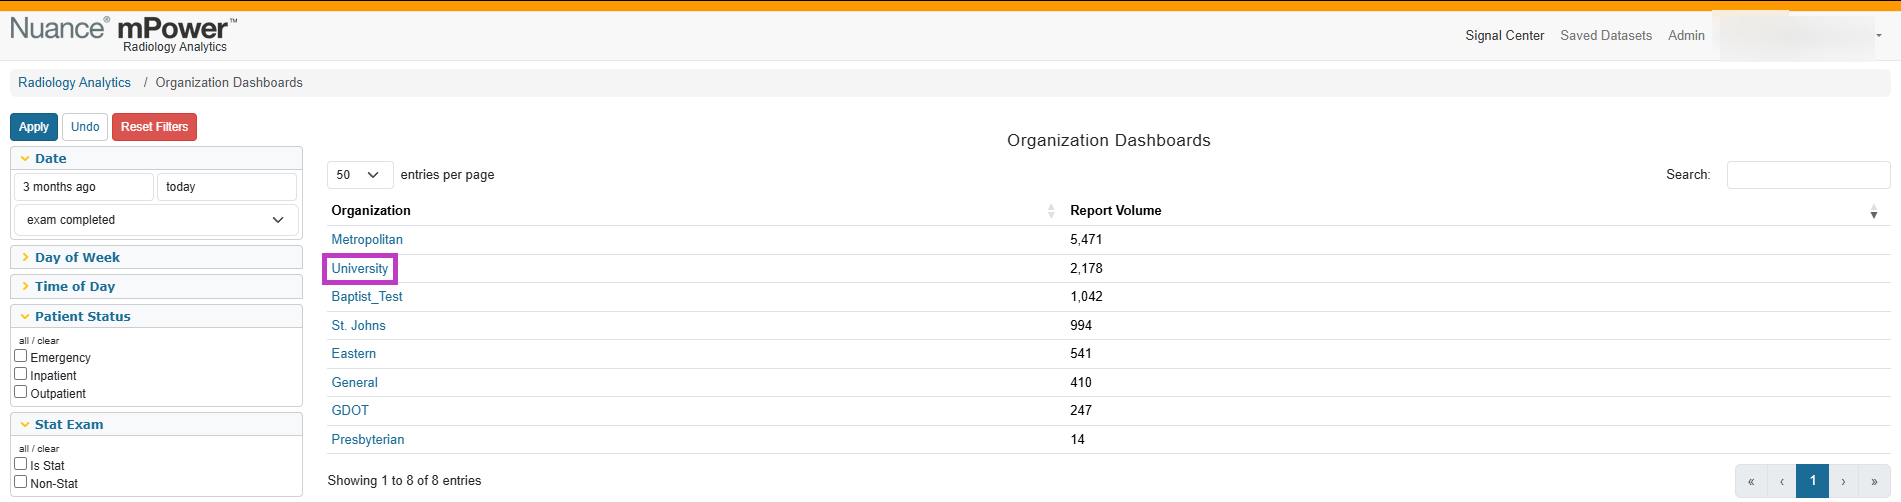
Choose an organization from the list.
The dashboard loads with charts and tables specific to the selected organization.
Next up: Review the Reporting Provider Dashboard in mPower
Analyze workload, turnaround times, and quality events by reporting provider to support productivity and performance review. Let's go