
mPower has introduced a feature that uses AI (Artificial Intelligence) to analyze diagnostic images and reports and compare this output to the NLU (Natural Language Understanding) to identify any discrepancies.
The AI Validation feature could identify if a Radiologist missed a finding that AI found. A retrospective analysis can be done on historical reports.
Note
Precision Imaging Network is a pre-requisite to utilize this feature and must already be enabled. Refer to the end of this article to view the algorithms supported for this feature.
AI Validation Dashboard
The AI Validation Dashboard can be accessed from the mPower QC (quality control) dashboards link. This dashboard provides the details of the AI Concordance and Discordance, e.g., the agreement between the AI algorithm and NLU results.
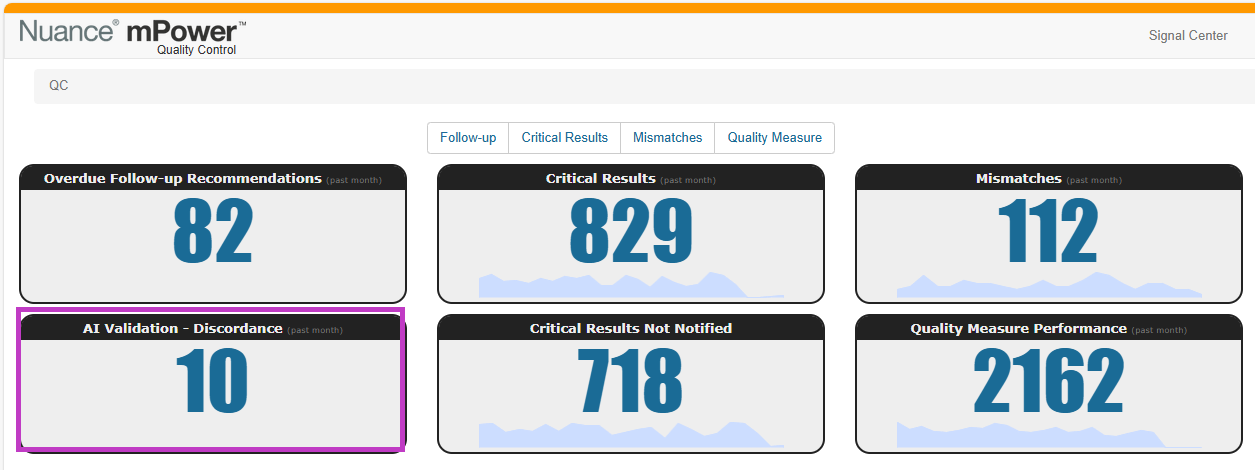
mPower will display the results for the specific algorithms’ findings (dependent on what is configured). Other AI algorithms will be included in future updates to the application logic.
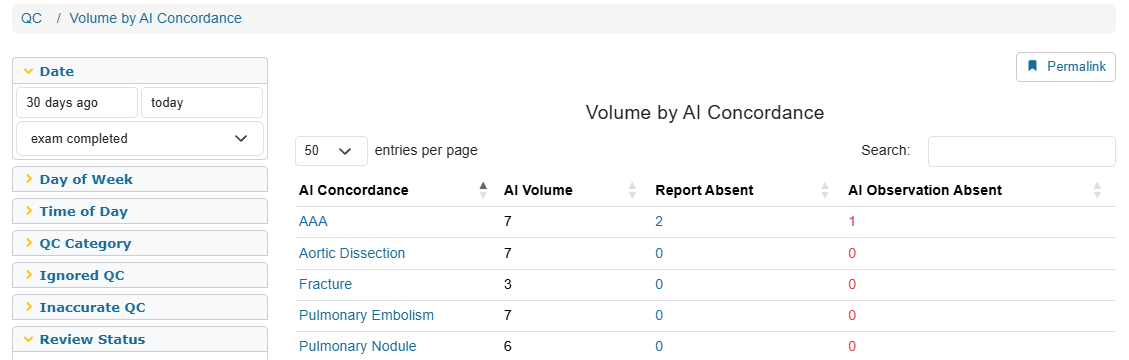
Confusion Matrix
Select the AI Concordance.
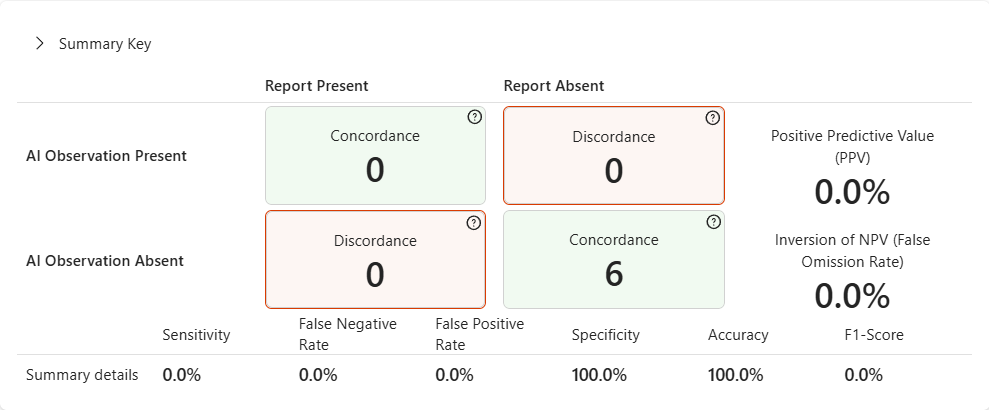
| mPower Present | mPower Absent | |
|---|---|---|
| AI Observation Present | AI and NLU match results | AI result only |
| AI Observation Absent | NLU result only | No results |
The Confusion Matrix table displays the number of instances where the NLU engine and the AI results either are in agreement or disagreement.
Confusion Matrix Calculations
| Measure | Calculation |
|---|---|
| AI Observation Present | The number of observation(s) detected by pixel AI in the dataset. |
| Positive Predictive Value (PPV/Precision) | Measure for the correctness of a positive prediction. |
| False Omission Rate | Ratio of false negative predictions to the total number of actual negative samples in the dataset. |
| Sensitivity (Recall) | Measure for how many true positives get predicted out of all of the positives in the dataset. |
| False Positive Rate (Fall-Out) | Ratio of the incorrectly predicted positives. |
| Accuracy | Measure for how many correct predictions AI made on the dataset. |
| False Negative Rate (Miss Rate) | Ratio of incorrectly predicted negative. |
| Specificity | Ratio of correctly predicted negative. |
| F1-Score | Mean of precision and recall. |
AI Observations
Other selections can be made from options in the menu on the left side of the screen to drill down into the findings from the AI model.
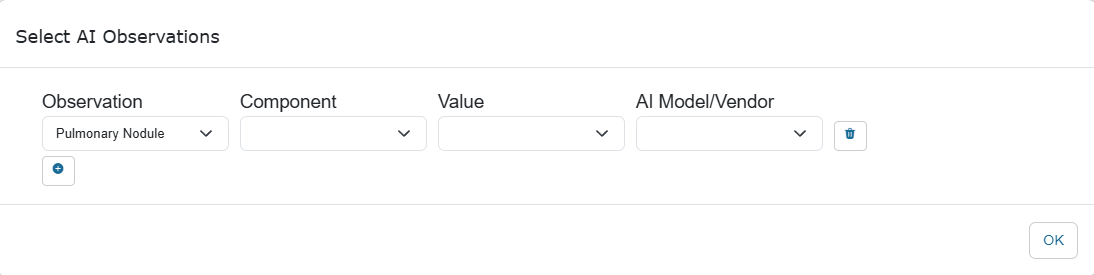
Select the Select AI Observations.
Select the desired options from each drop-down menu.
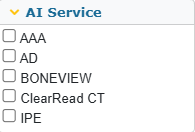
AI Service(Precision Imaging Network)
Choose the desired service.
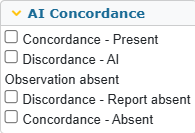
AI Concordance
The results of the Confusion Matrix can be viewed individually when a selection is made. All relevant reports will display each option(s) chosen.
Advanced Search
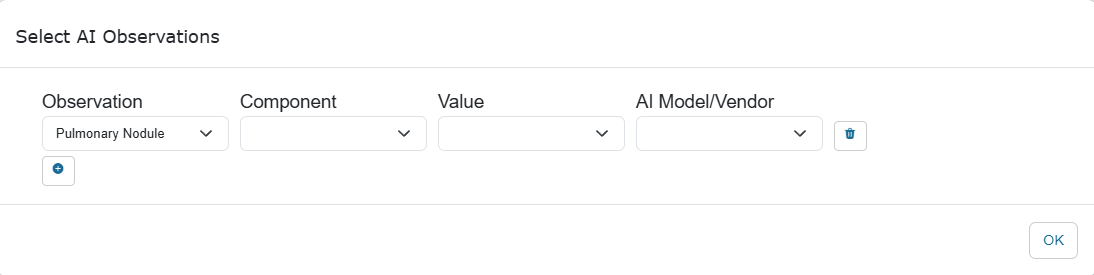
Choose Advanced Search from the mPower home screen. - Navigate to AI Observations in the list. Select Select AI Observations. - Select the desired options from each drop-down menu. - Select the + sign to add another line of filters. - These filters would be added to the initial line of filters, i.e., “And” operator function. - Select OK.
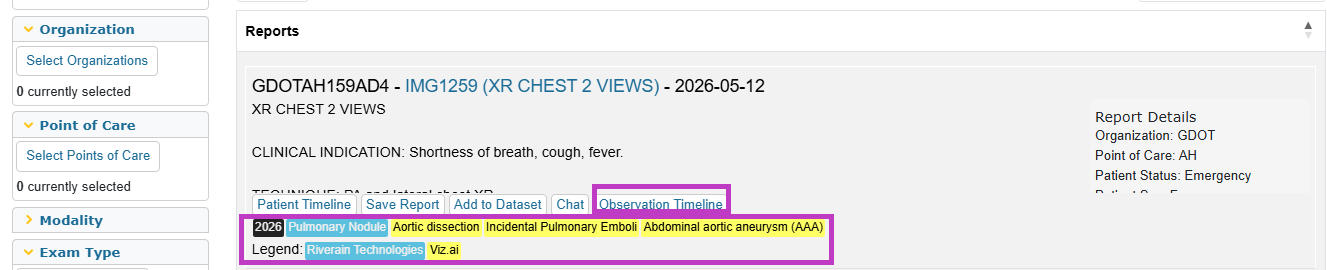
The list of reports will appear. If an AI Observation appears on a report, the Observation Timeline button appears. The respective observations show in the legend.
Note
An addendum will update the NLU. If the report is reviewed, the status does not change for the specific algorithm.
Analytics
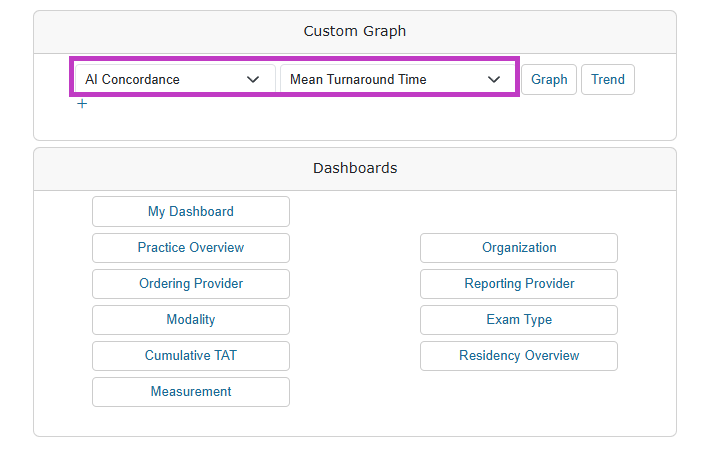
Select mPower Analytics from the home screen. The Custom Graph section will allow you to run analytics on AI Validation data.
There are two drop-down menus: One for Concepts and one for Measures (what the concept is measured on). Make the desired selections and choose either Graph or Trend to view the results.
User Group Permission
Admin Users
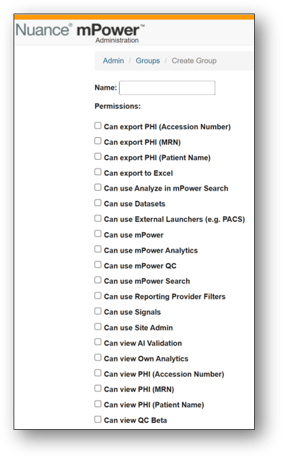
A user group permission can be enabled for any existing group if Precision Imaging Network is configured. It is turned off by default.
Navigate to Admin > Groups > Permissions > “Can view AI Validation”
Precision Imaging Network Services
Precision Imaging Network facilitates access to a library of third-party AI algorithms for a range of imaging modalities and specialty areas and is integrated with mPower. Currently, the following AI Services are integrated into the mPower AI Validation feature.
| PIN (AI) Service | Functionality |
|---|---|
| Riverain ClearRead CT | Identifies and measures pulmonary nodules. |
| Gleamer BoneView | Identifies bone fractures. |
| Viz.ai AAA | Identifies abdominal aortic aneurysm. |
| Viz.ai AD | Identifies aortic dissection. |
| Viz.ai iPE | Identifies incidental pulmonary embolism. |
Explore more
Already using mPower? Explore More Help to quickly find what you need and start learning today.