
The Ordering Provider Dashboard in mPower Analytics help you understand ordering patterns and performance by referring providers. These dashboards display key productivity and turnaround time metrics so you can review trends and drill into details when needed.
What the Ordering Provider Dashboard shows
The Ordering Provider Dashboard displays analytics for a selected ordering provider. Depending on your data and permissions, it includes:
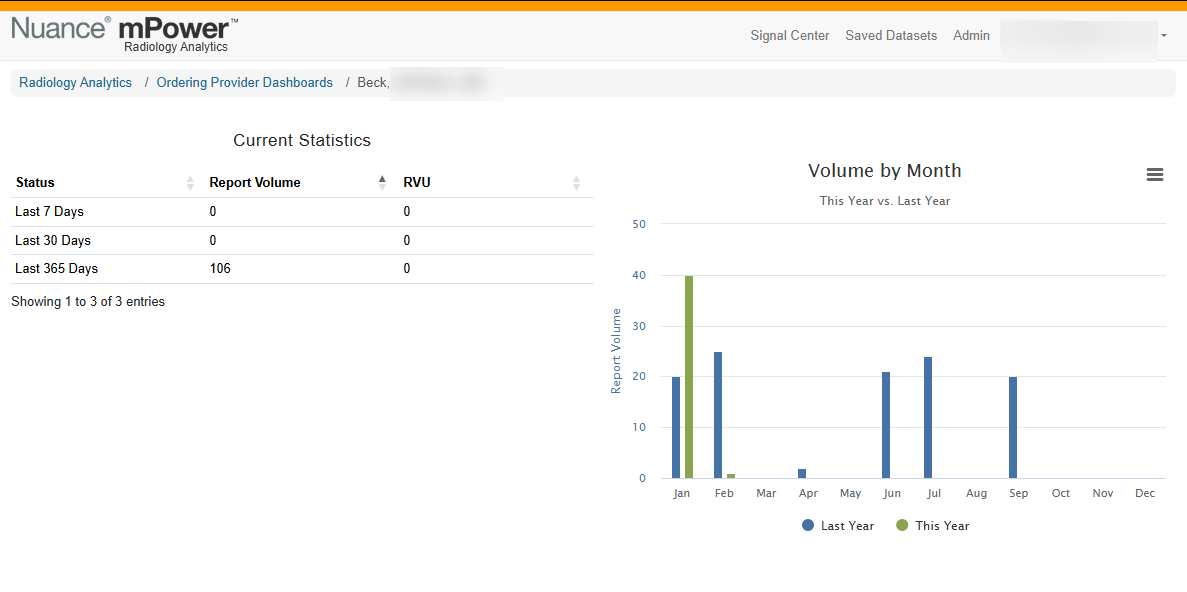
- Current statistics for the selected provider
- Exam volume, work RVUs, and median turnaround time by day (last 30 days)
- Exam types ordered (top exam types in recent activity)
- Monthly volume and work RVU trends (year over year)
- Median turnaround time by patient status
- Median turnaround time by stat vs. non‑stat exams
- Modality distribution and patient status trends
- Activity by organization
- Patient Status (Last 30 days)
These views help you understand how ordering providers interact with the practice.
Open an Ordering Provider Dashboard
To access the Ordering Provider Dashboard:
Sign in to mPower.
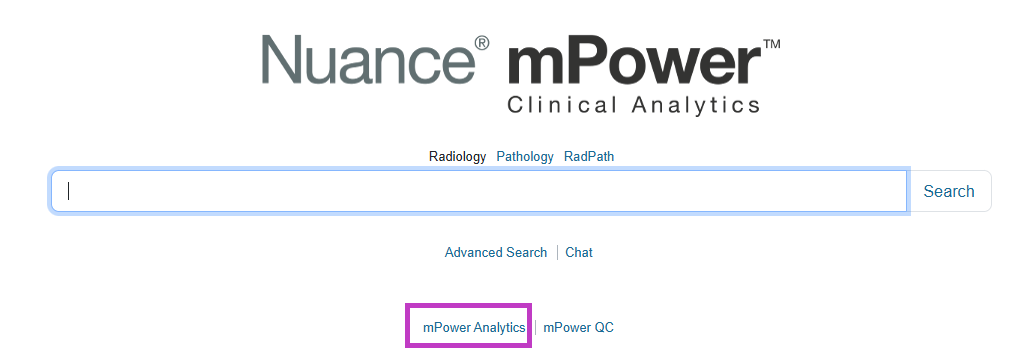
Select mPower Analytics from the main page.
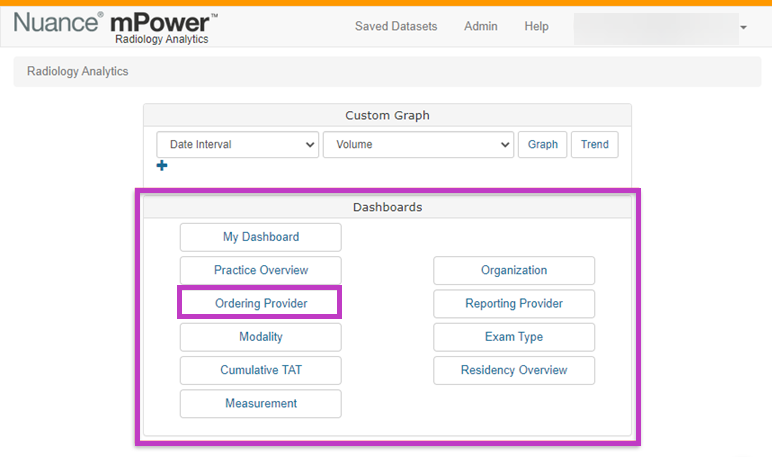
Open Dashboards.
Select Ordering Provider.
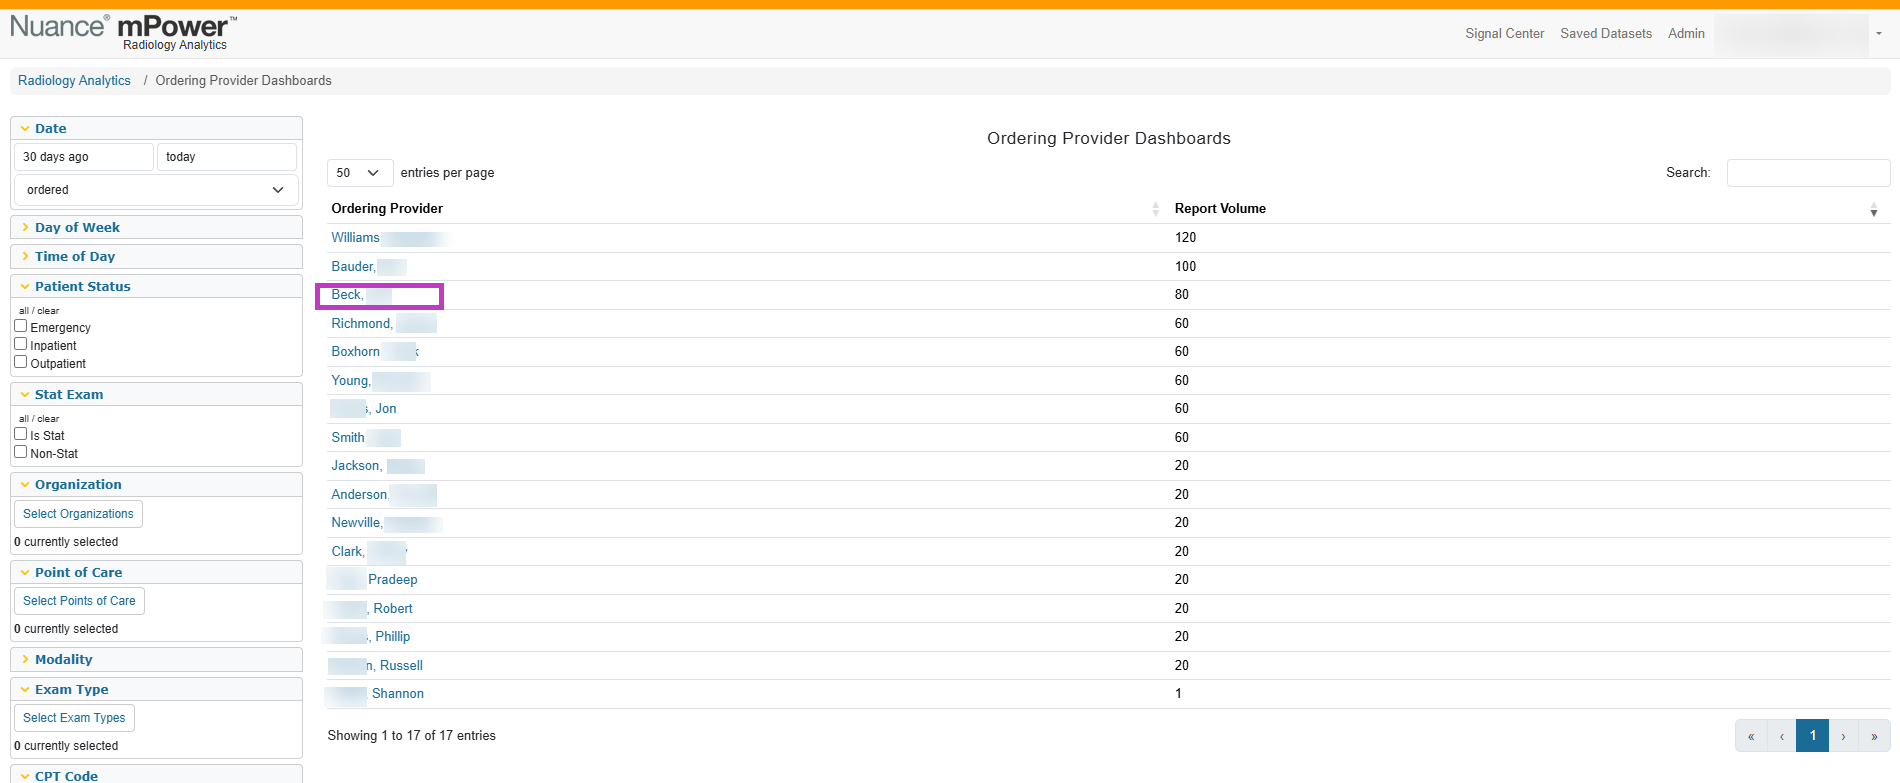
Choose an ordering provider from the list.
The dashboard opens with charts and tables specific to the selected provider.
Next up: Review the Modality Dashboard in mPower
Analyze exam volume and turnaround times by modality to identify workflow trends and performance differences. Let's go