
Practice Overview Dashboard in mPower Analytics provide a high‑level view of practice productivity and performance. They combine multiple visualizations on a single page to help you quickly understand trends across volume, turnaround time, and quality‑related activity.
What Practice Overview Dashboard show
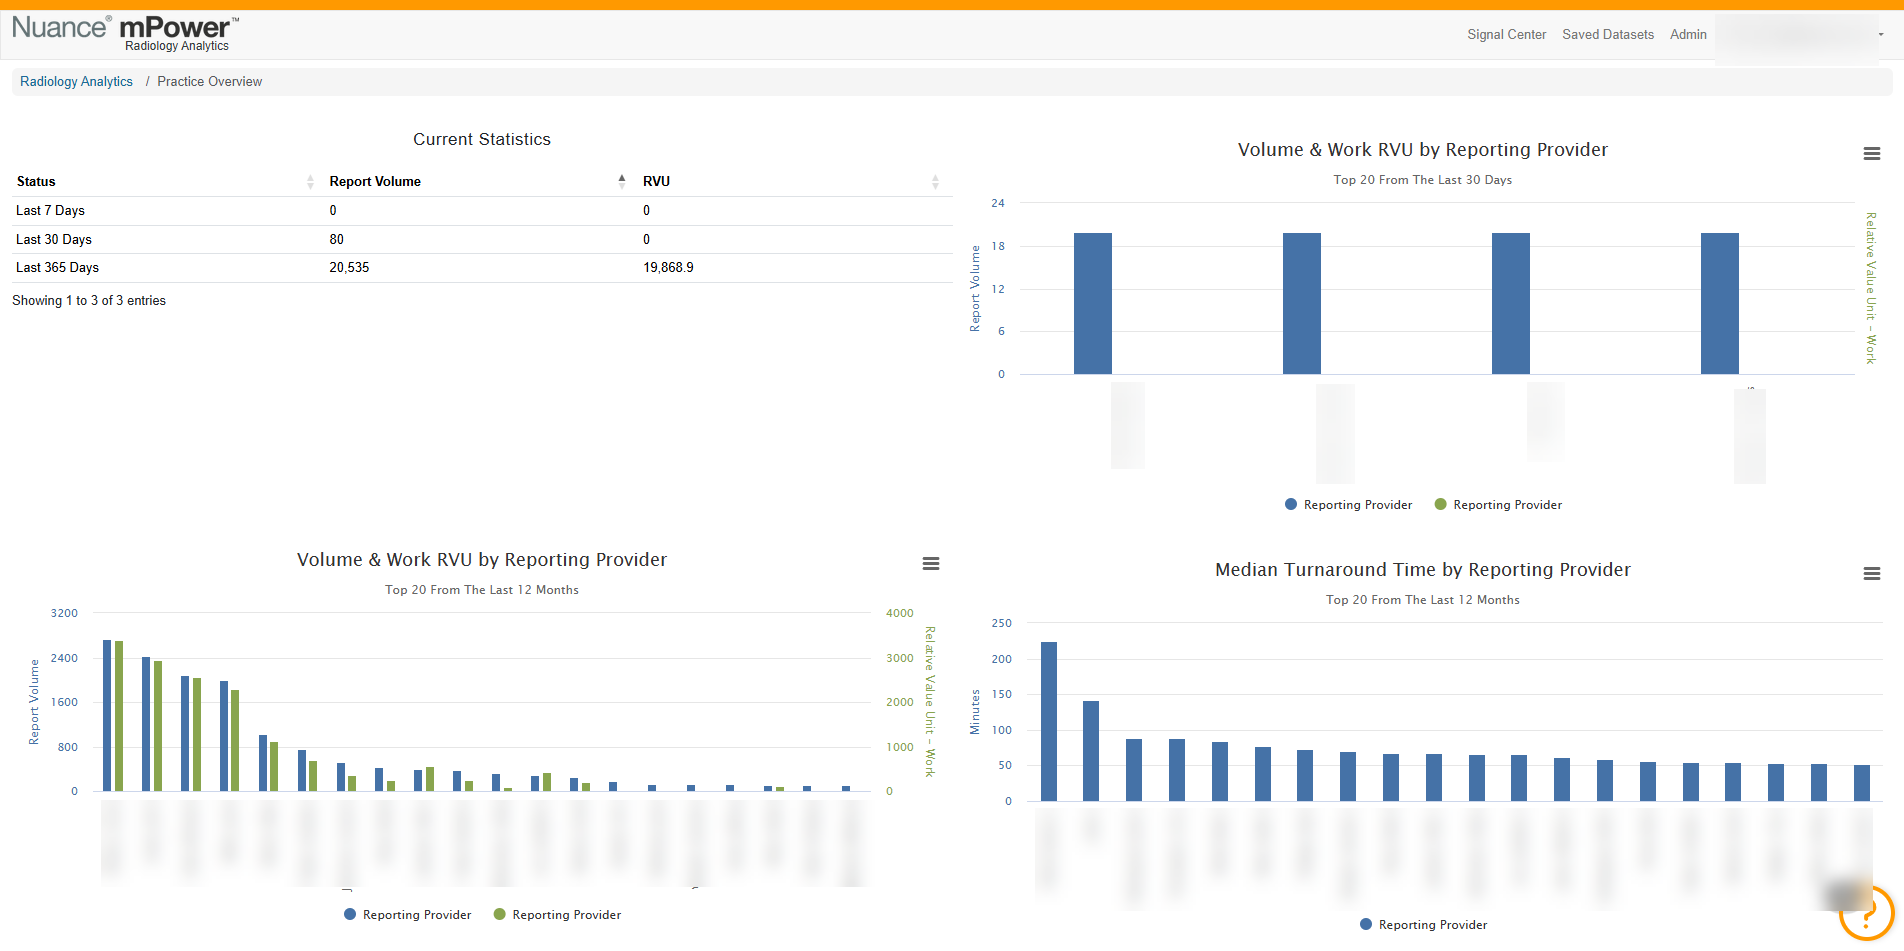
Practice Overview Dashboard use the same analytics logic as Custom Graphs but present commonly needed metrics in prebuilt views. Depending on your role and permissions, these dashboards might display:
- Current Statistics.
- Volume and Turnaround Time by Modality.
- Volume & Work RVU by Reporting Provider (Top 20 from the last 30 days).
- Volume & Work RVU by Reporting Provider (Top 20 from the last 12 months).
- Median Turnaround Time by Reporting Provider (Top 20 from the last 30 days).
- Median Turnaround Time by Reporting Provider (Top 20 from the last 12 months).
These views give you an at‑a‑glance understanding of how the practice is performing.
Access Practice Overview Dashboard
To open Practice Overview Dashboards:
Sign in to mPower.
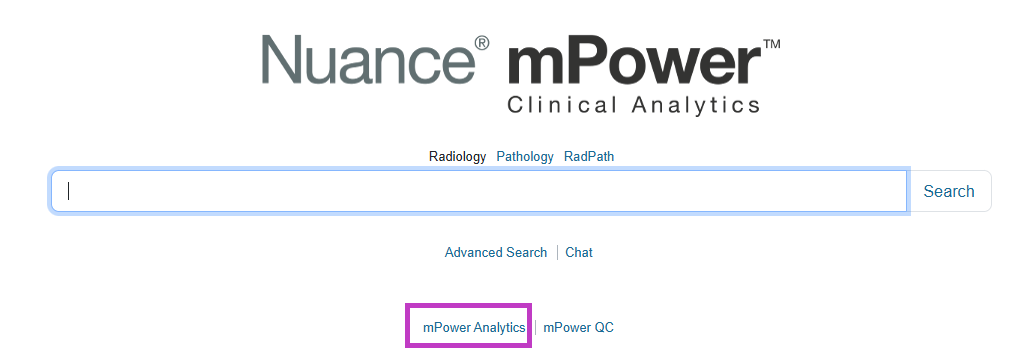
Select mPower Analytics from the main page.
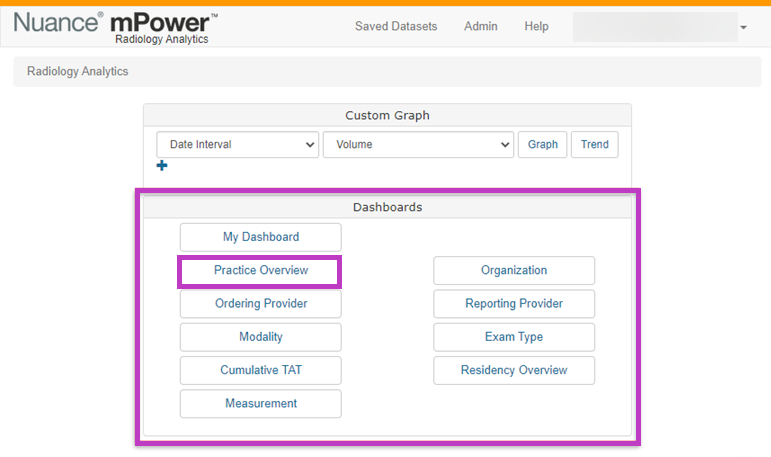
Select Dashboards.
Choose Practice Overview dashboard from the available options.
The dashboard opens with multiple charts summarizing practice‑level metrics. The screenshot below shows examples included in the Practice Overview dashboard.
Next up: Review the Ordering Provider Dashboard
Review exam volume and activity by ordering provider to understand referral patterns and support operationa## Usl decision‑making. Let's go