
When you export analytics data in mPower, you can take filtered results outside the application for further review, reporting, or sharing. You can export both detailed report data and summary analytics from custom graphs.
When to export analytics data
Export analytics data when you want to:
- Review results offline.
- Share findings with stakeholders.
- Perform additional analysis outside mPower.
All exported data reflects the filters and selections you apply in your analytics view.
How to export data from Custom Graph
You can export data directly from a custom graph after building your analysis.
To export analytics data:
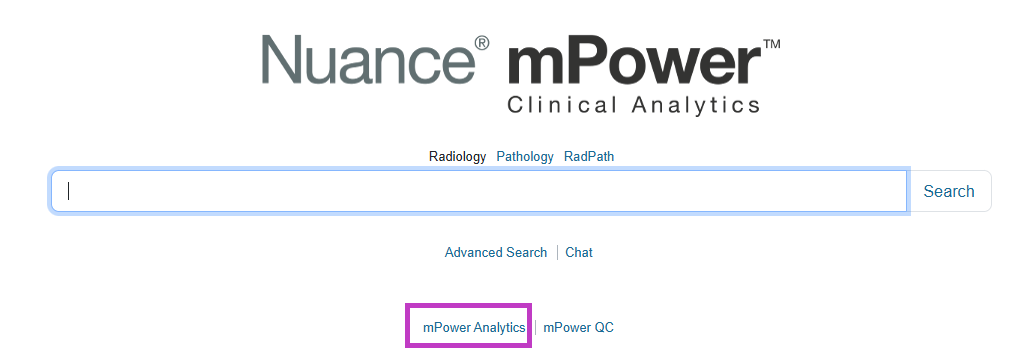
Open mPower Analytics.
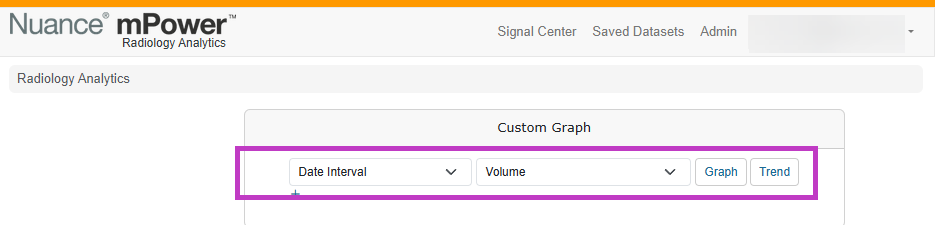
Select Custom Graph and apply your concepts, measurements, and filters.
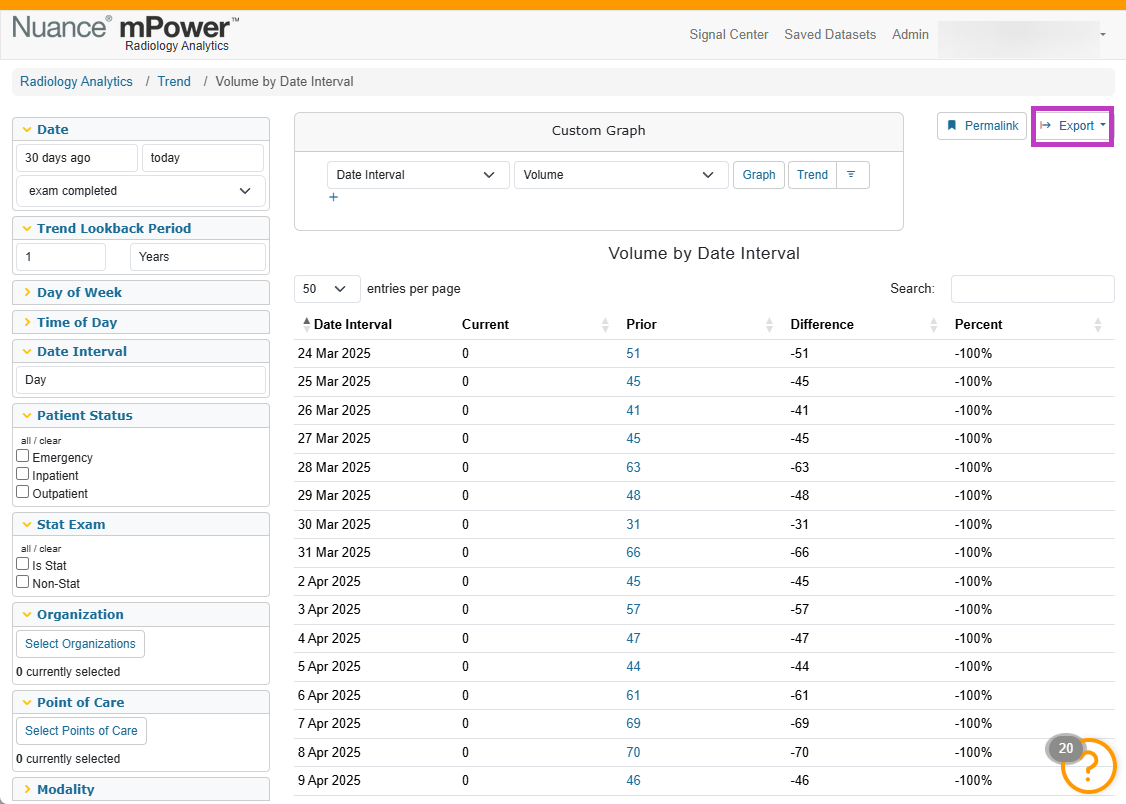
In the upper‑right corner of the Custom Graph page, select the appropriate Export option.
Choose a file format, such as Excel (XLS) or CSV, and download the file.
The exported file includes only the data that matches your selected filters and time range.
Export graph summaries
To recreate visuals outside mPower:
- Use Graph Summary to download the underlying data points used in the graph.
- Open the file in Excel to build your own charts or tables.
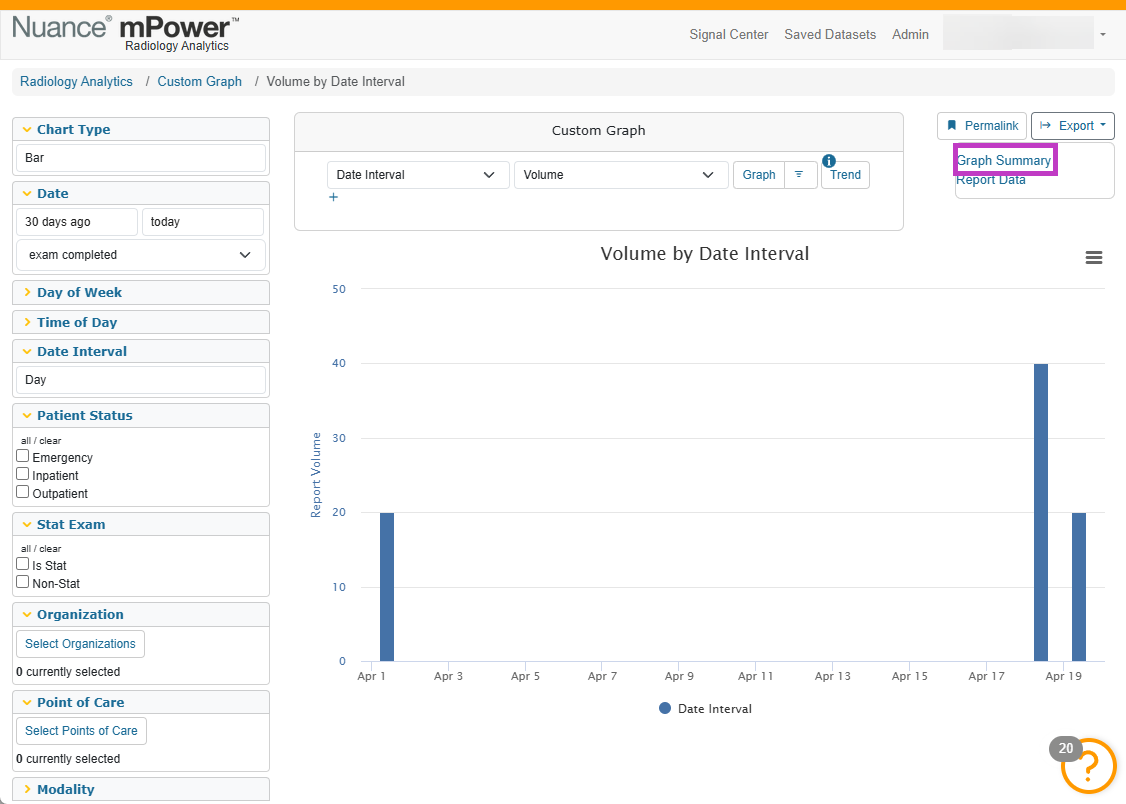
This option is helpful for presentations, reports, or external analysis.
Download chart images
You can also save a visual copy of a graph:
Select the Download icon on the graph.
Save the chart image to use in presentations or documentation.
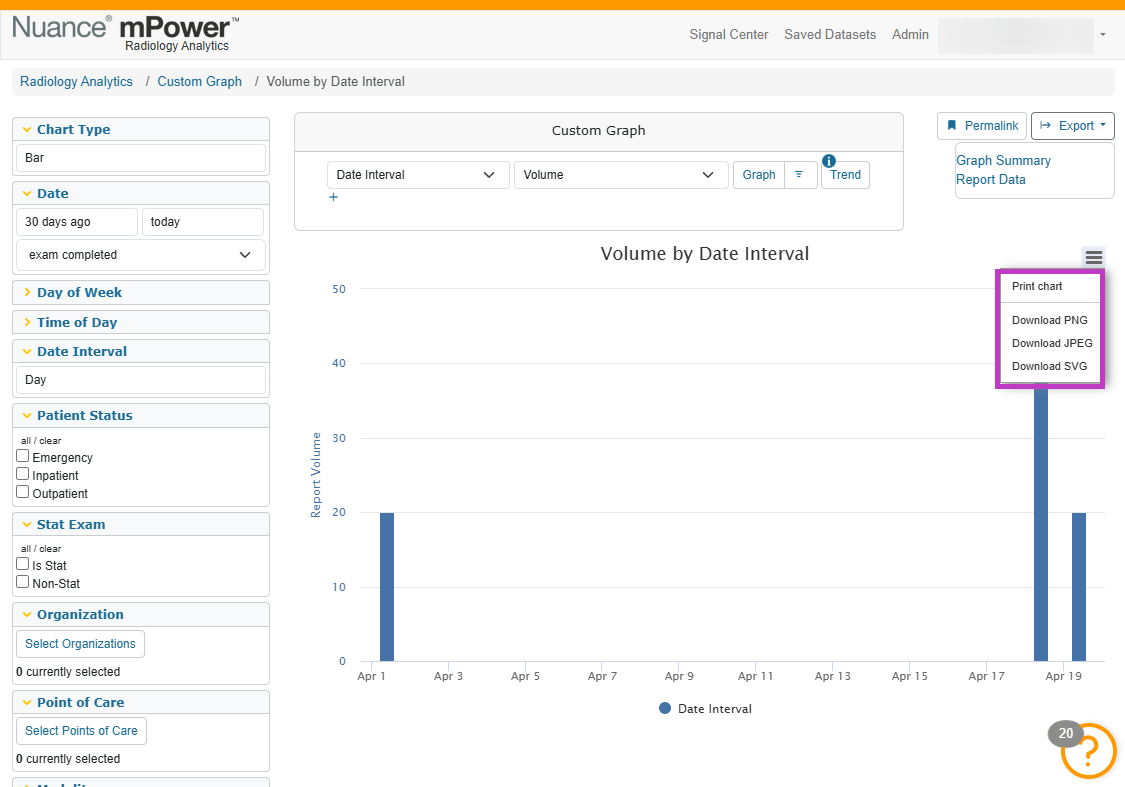
Modern browsers support chart image downloads.
Next up: Share analytics using permalinks
Create permalinks to save or share analytics views so you can quickly reopen the same graph with all filters applied. Let's go