
The Cumulative TAT (Turnaround Time) Dashboard in mPower Analytics helps you track how interpretation turnaround times accumulate across exams over a selected period. It provides a clear view of efficiency trends and supports performance and workflow analysis.
What the Cumulative TAT Dashboard shows
The Cumulative TAT Dashboard presents turnaround time data aggregated over time, helping you understand overall performance rather than individual exam results. Depending on your data and permissions, it may show:
- Cumulative turnaround time trends over the selected date range
- Changes in turnaround efficiency across reporting periods
- Comparison of turnaround performance over time
- Visual indicators that highlight increases or improvements in TAT
This view helps identify long‑term patterns that may not be visible in daily or single‑exam metrics.
Open the Cumulative TAT Dashboard
To access the Cumulative TAT Dashboard:
Sign in to mPower.
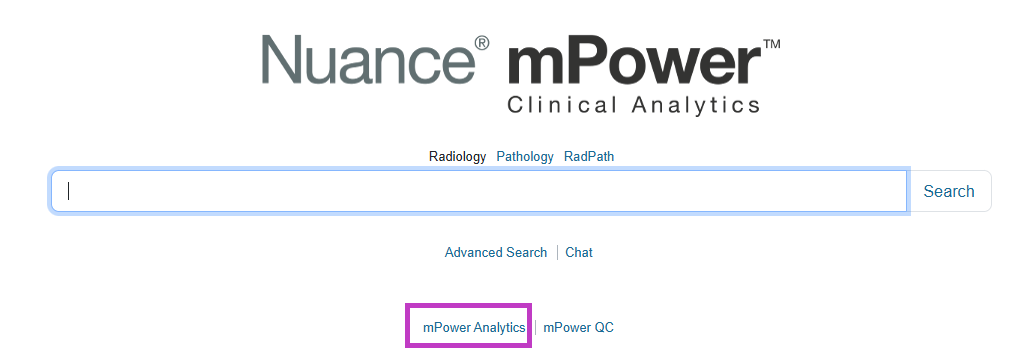
Select mPower Analytics from the main page.
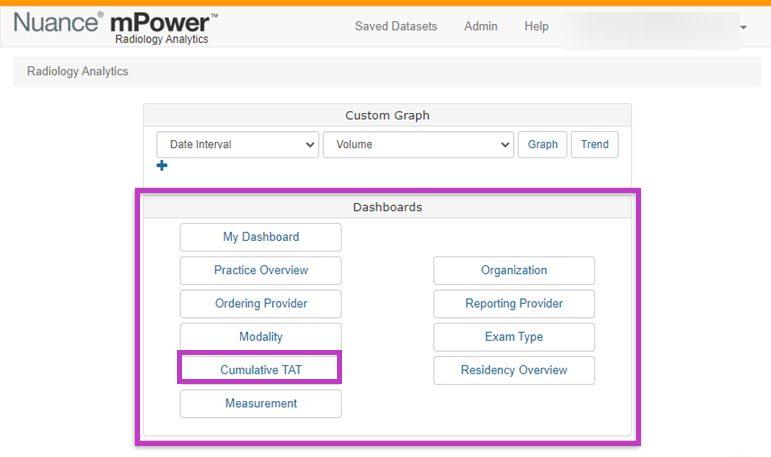
Open Dashboards.
Select Cumulative TAT.
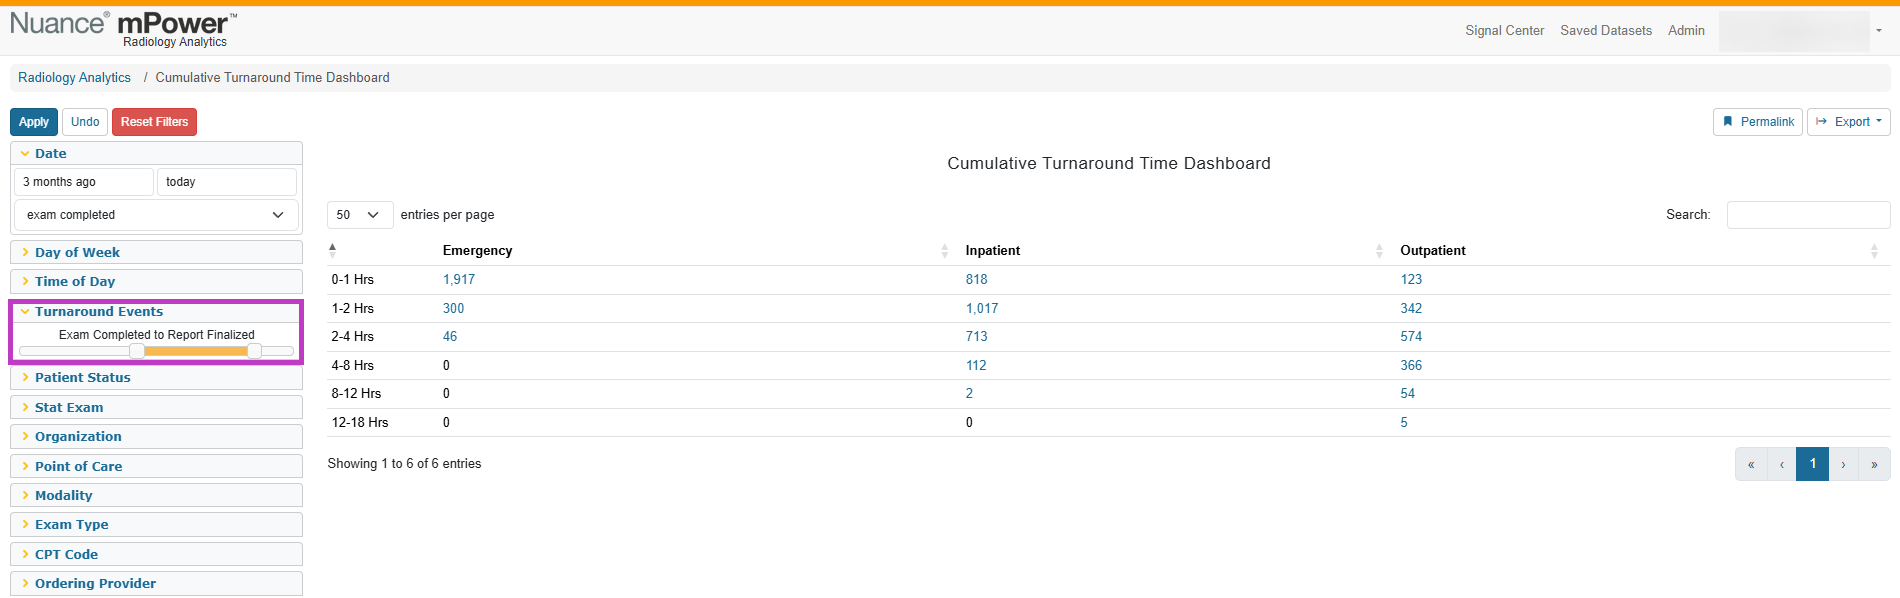
The dashboard loads with cumulative turnaround time charts based on available data. The Turnaround Events slider bar contains two marking buttons that allow you to select a range of events on which to view turnaround times. By moving the marking buttons left or right (or by selecting on the bar itself), you can select which two of the following events you would like to view: • Ordered • Scheduled • Exam Started • Exam Completed • Report Created • Preliminary Report • Report Finalized • Report Addendum
Next up: Review the Measurement Finding Dashboard in mPower
Analyze extracted measurements such as nodules or lesions and drill into related reports to review sizes and follow‑up patterns. Let'go.