
Use the Quality Measure Dashboard in mPower QC to quickly review quality and compliance results identified in radiology reports. This article shows what the dashboard displays and how to review reports efficiently as part of your QC workflow.
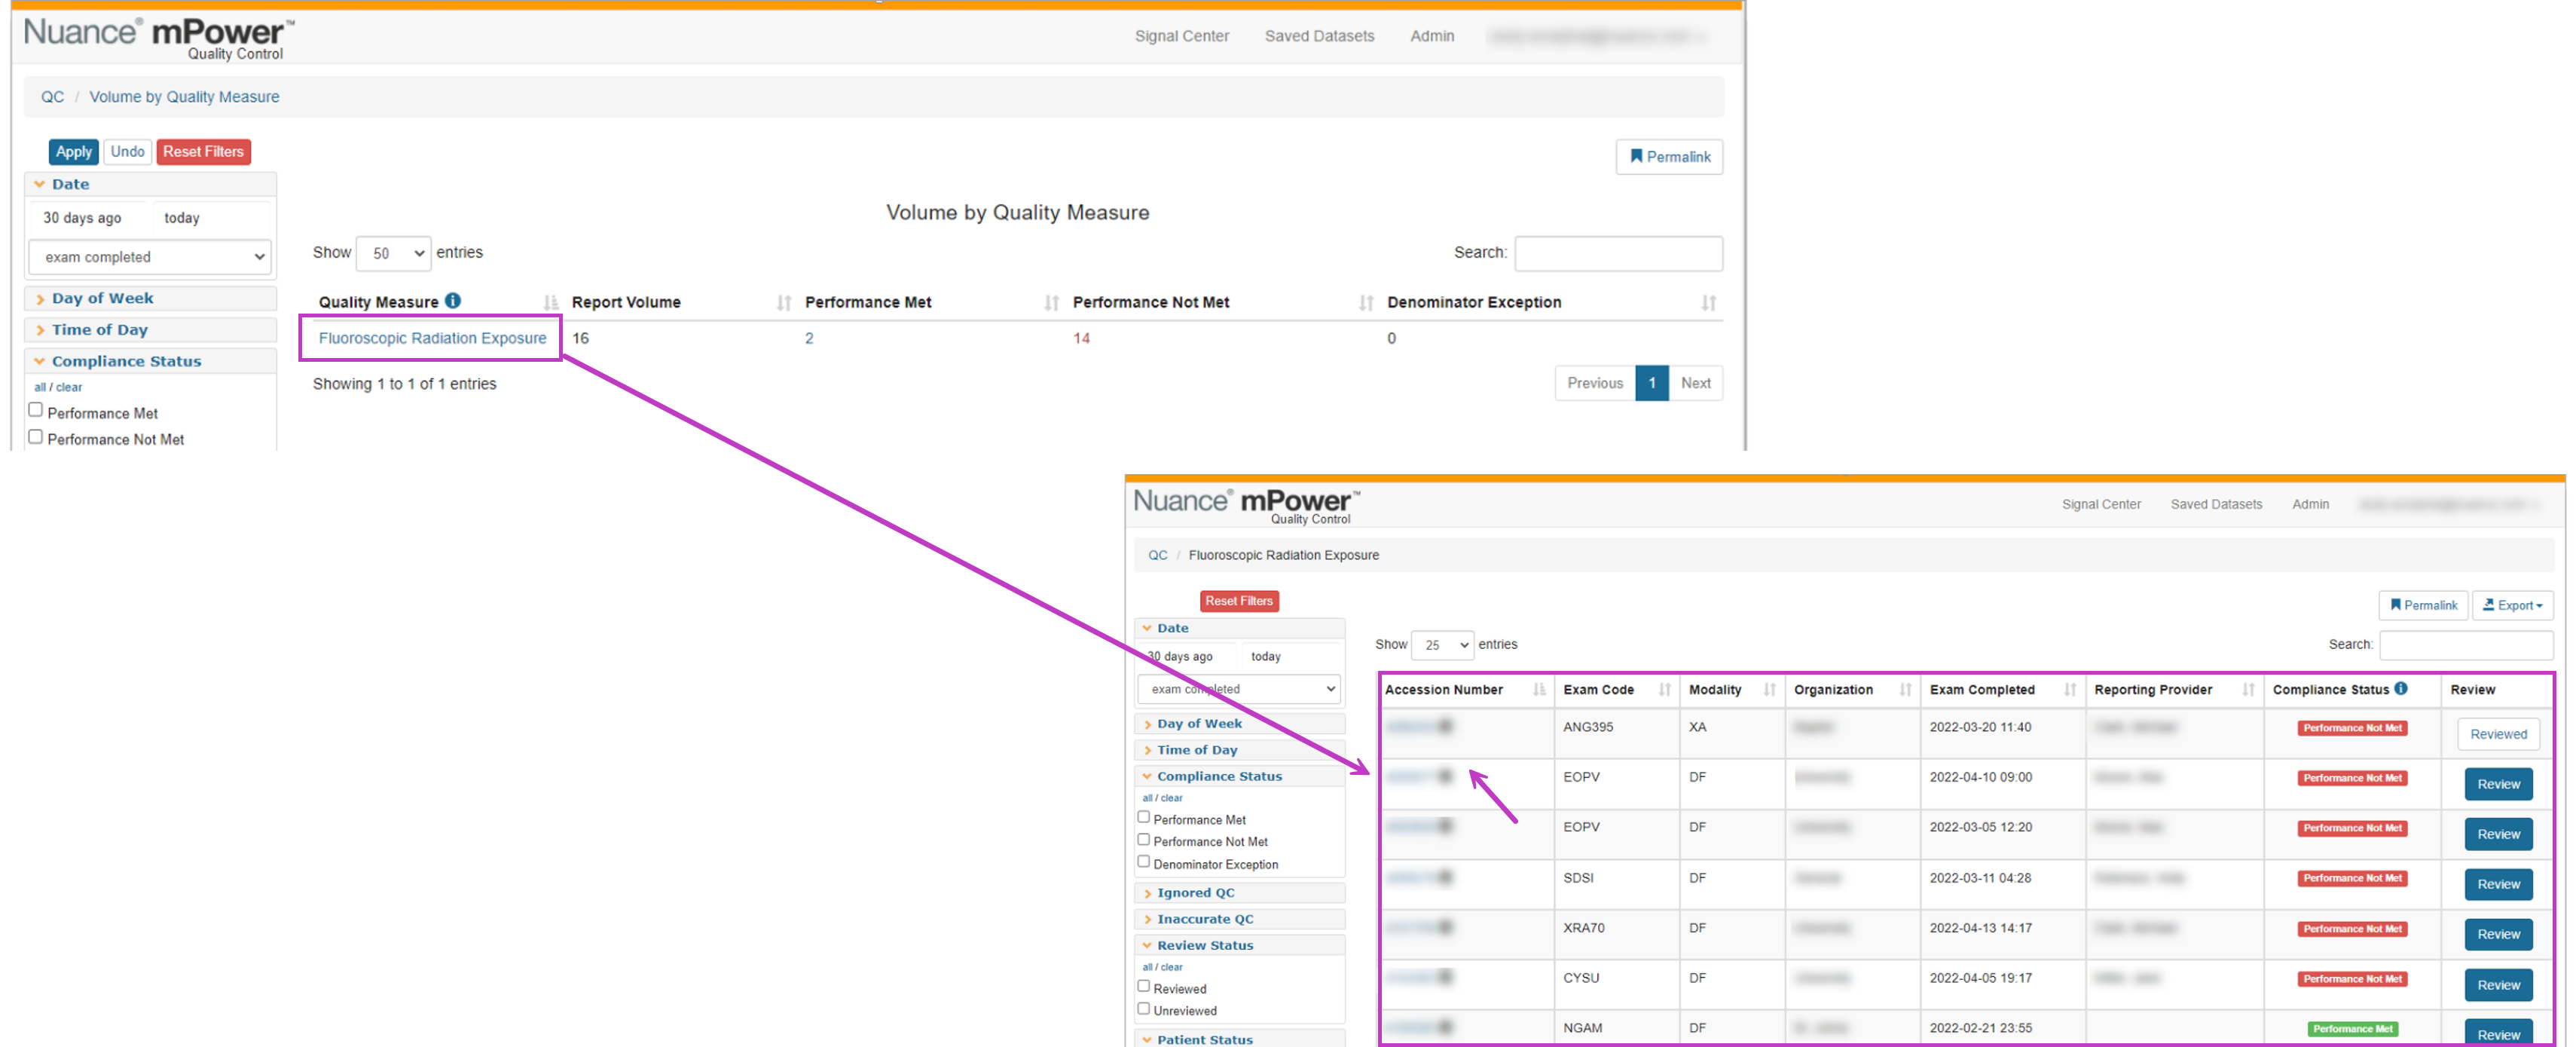
The Quality Measure Dashboard summarises Quality Measure activity from the past 30 days, including:
- Quality Measure names
- Report volume per measure
- Counts of compliant and non‑compliant reports
Tip
Use this view to quickly spot measures with higher non‑compliance so you can prioritize reviews.
Access the Dashboard
Sign in to mPower Clinical Analytics.
Select mPower QC.
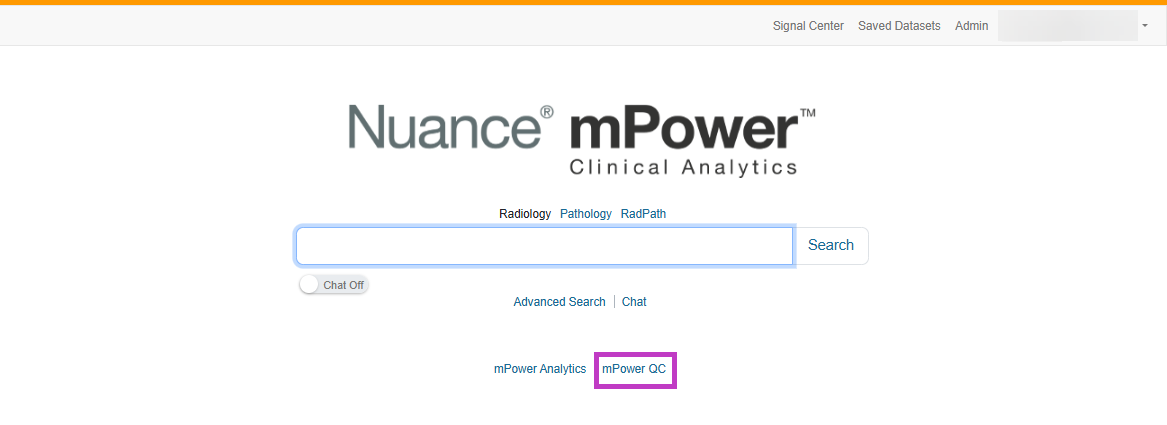
Locate the Quality Measures section on the QC home page.
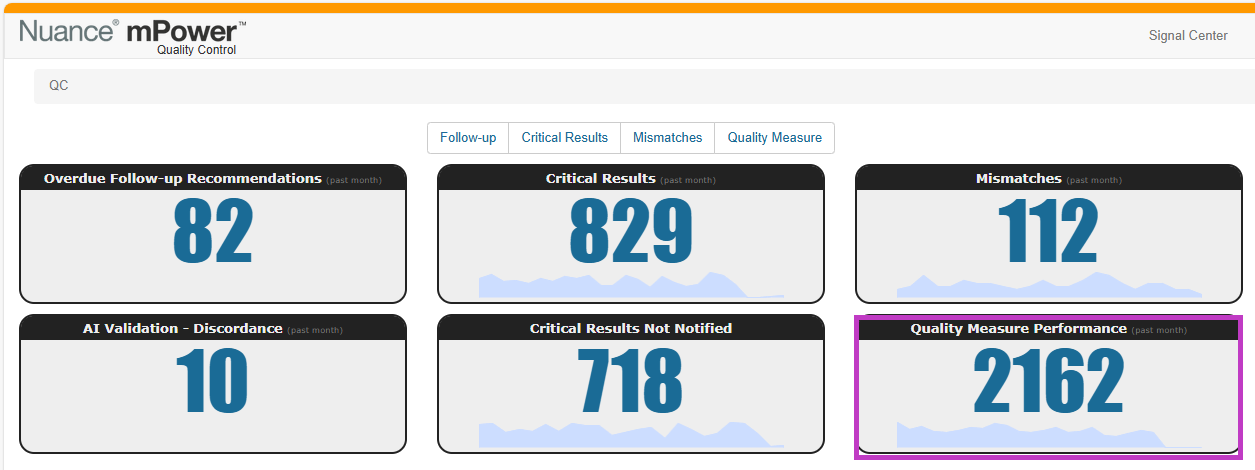
Select the Quality Measure name.
Tip
Select the tooltip (next to "Quality Measure") to review the CMS compliance criteria for the CQM and QCDR currently supported by mPower.
Review the list of matching reports.
Open a report using the Accession Number.
Select Review to complete the QC review.
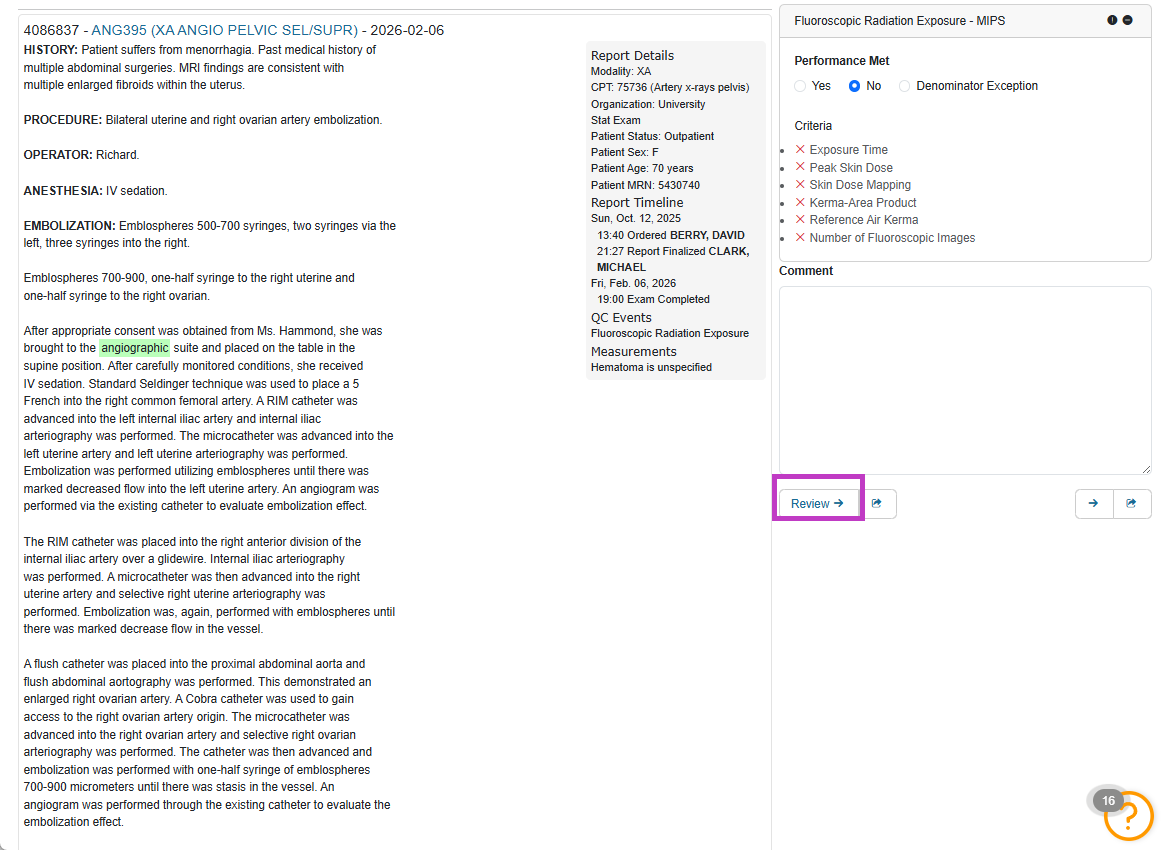
During review:
- Quality Measure criteria are highlighted in the report.
- Performance criteria appear alongside the report details.
Important
Once a Quality Measure event is marked Reviewed, the review decision always overrides automated detection.
Next up: Review the AI Validation dashboard in mPower
Learn how to review AI‑detected quality events, validate results using datasets, and apply human judgement to keep mPower QC findings accurate. Let's go.