
The AI Validation Dashboard in mPower QC helps you review and validate quality events identified by AI. It combines AI‑detected results with human review so that Quality Control (QC) findings remain accurate, reliable, and clinically meaningful.
AI analyses report text using Natural Language Understanding (NLU). However, your review decisions always take priority over AI results.
Use the AI Validation Dashboard to:
- View QC events detected by AI, including:
- Follow‑up Recommendations
- Critical Results
- Mismatches
- Quality Measure events
- Validate AI results using Saved Datasets
- Confirm correct findings and identify false positives
- Improve QC results through consistent review
Access the AI Validation Dashboard
Sign in to mPower.
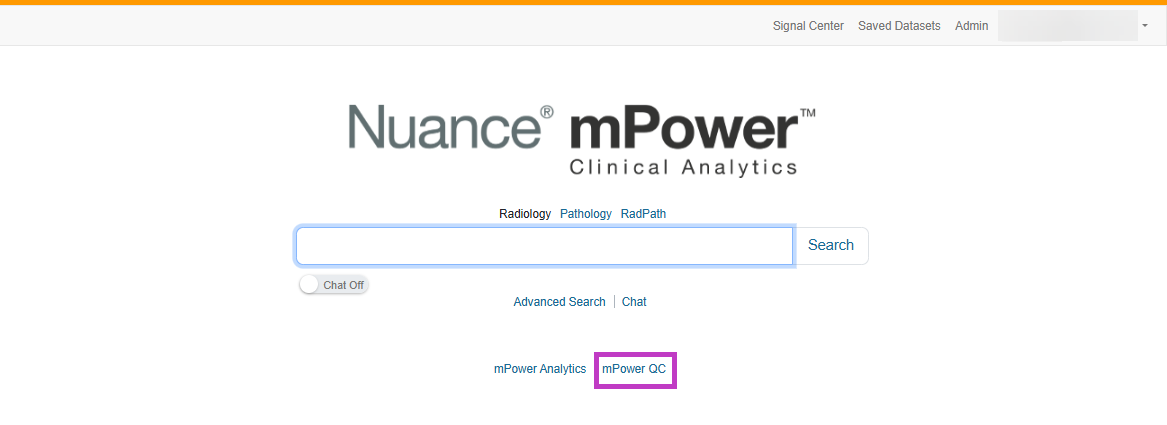
Select mPower QC from the home page.
Important
You must have AI Validation enabled to access this dashboard.
Open a QC dashboard or Saved Dataset to start reviewing AI-detected events.
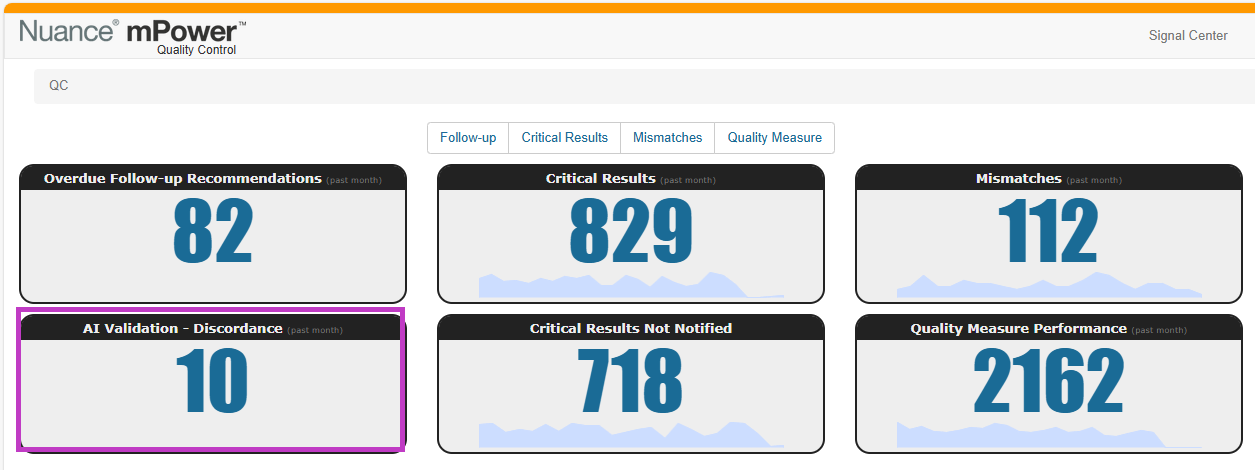
The AI Validation discordance dashboard shows the number of reports where the AI algorithm data did not agree with the NLU data.
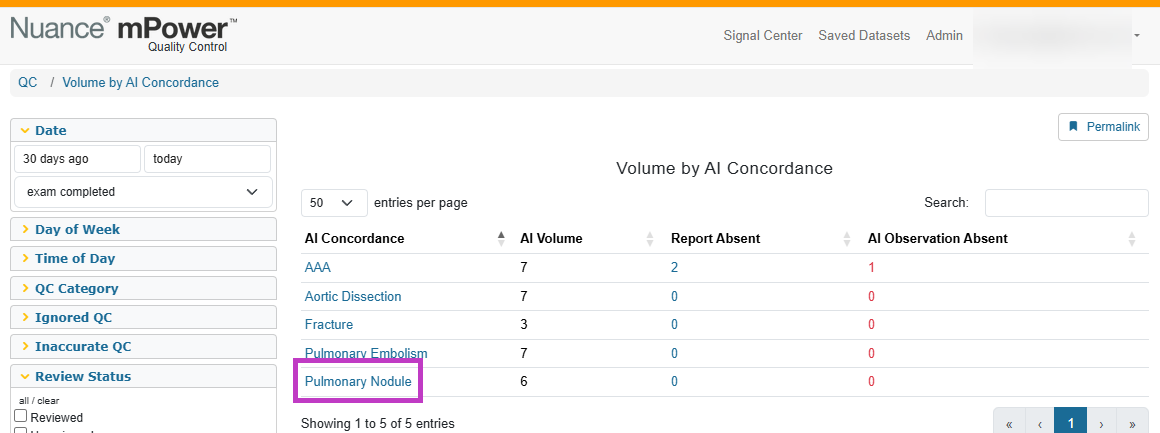
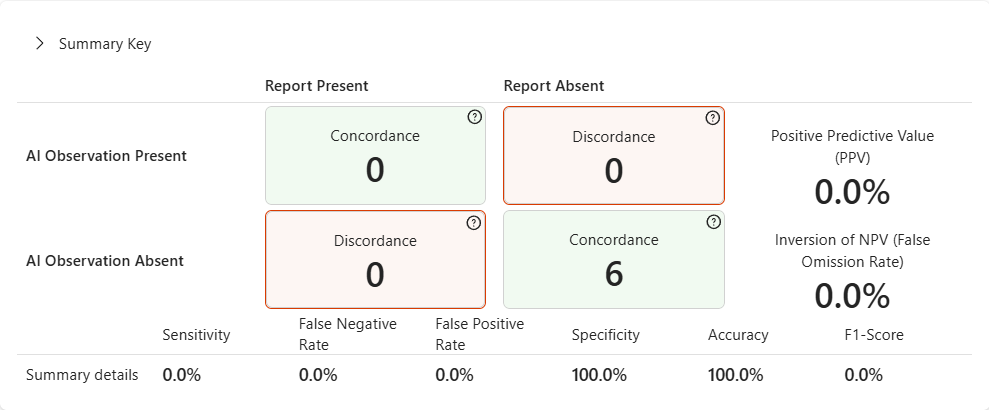
Select the AI Concordance from the table, the confusion matrix appears. The confusion matrix table displays the number of instances where the NLU engine and the AI results are either in agreement or disagreement.
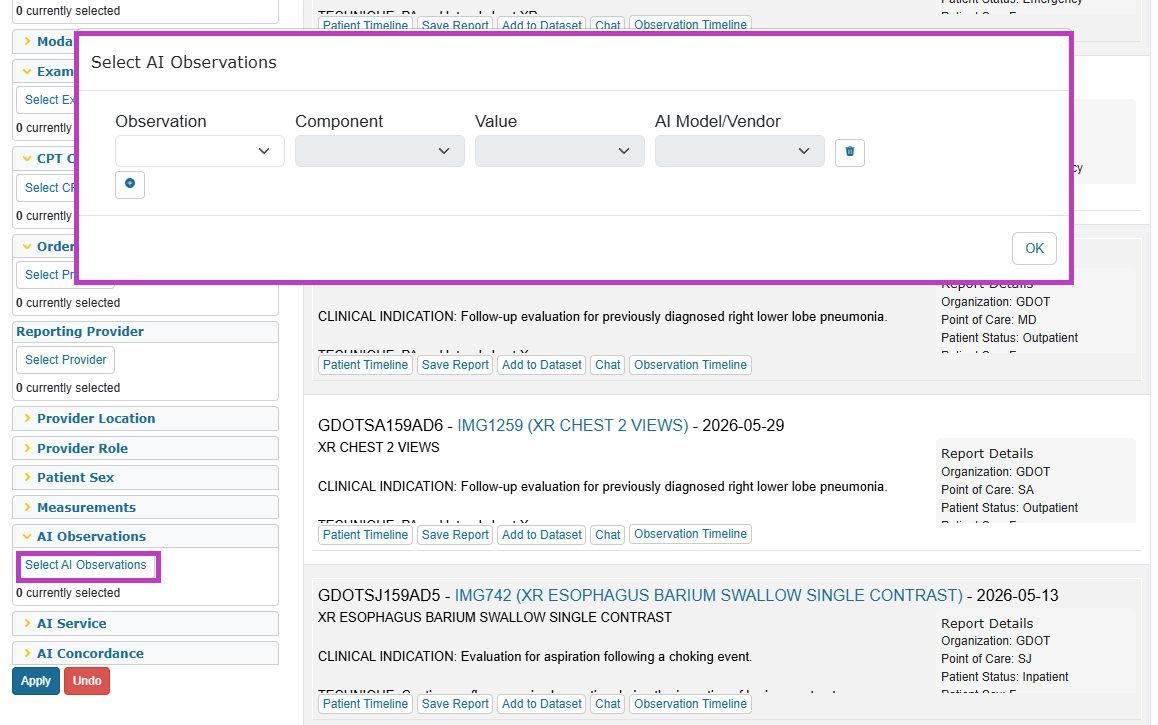
AI Observations can also be viewed from advanced search within the drill-down menus. Select the AI Observations button.
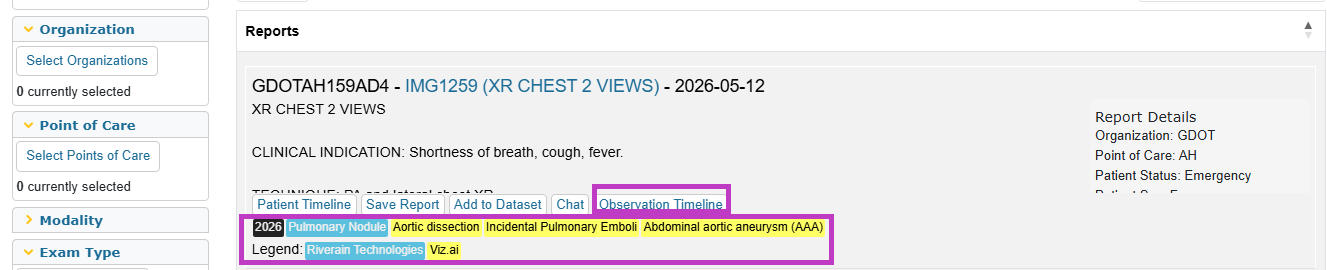
The list of reports will appear. If an AI Observation appears on a report, the "Observation Timeline" button appears. The respective observations show in the legend.
Next up: mPower use cases
Learn how mPower helps you find key insights, track follow‑ups, and turn unstructured data into actionable results using real‑world scenarios. Let's go.