
Use the Analytics dashboard in PowerShare to monitor your usage, track activity, and understand how your network is growing.
What is the Analytics dashboard?
The Analytics dashboard provides insights into how your facility uses PowerShare.
You can view metrics related to:
Usage and activity
Image uploads and sharing
Network growth and adoption
The dashboard helps you understand how your PowerShare network is expanding over time.
Analytics doesn't display any Protected Health Information (PHI).
Open the Analytics dashboard
Sign in to your PowerShare account.
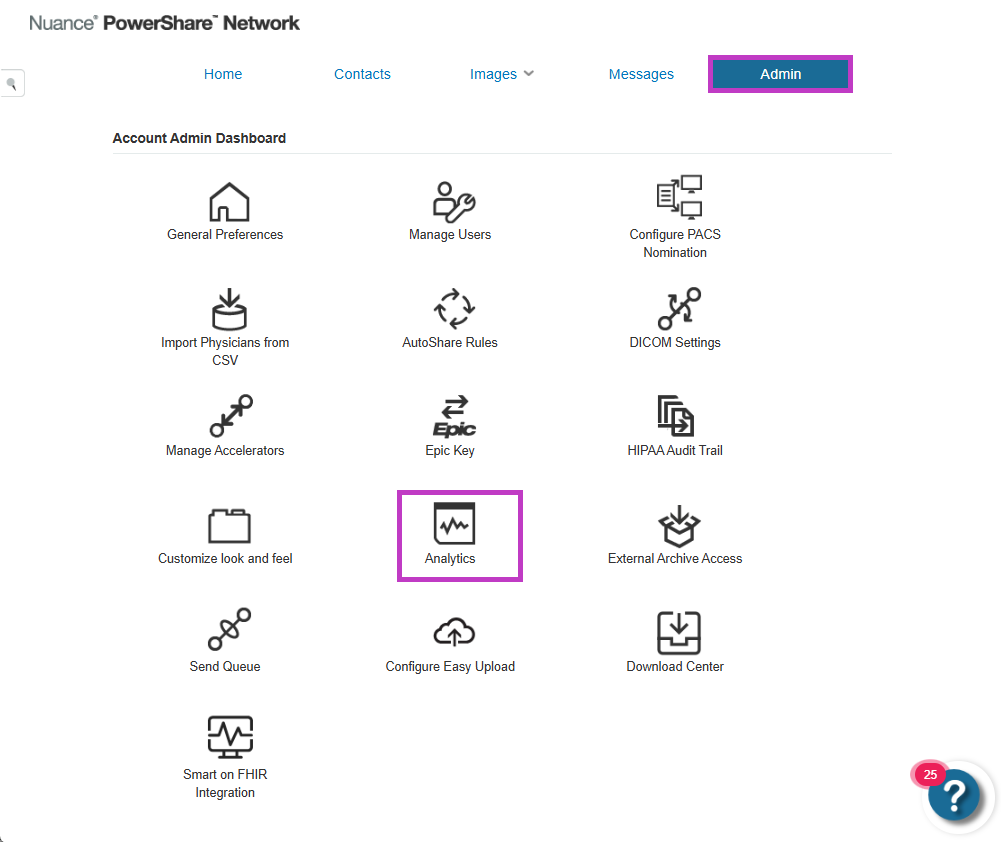
Select the Admin tab.
Select Analytics. The dashboard opens in a new tab with your facility’s data.
View usage and adoption metrics
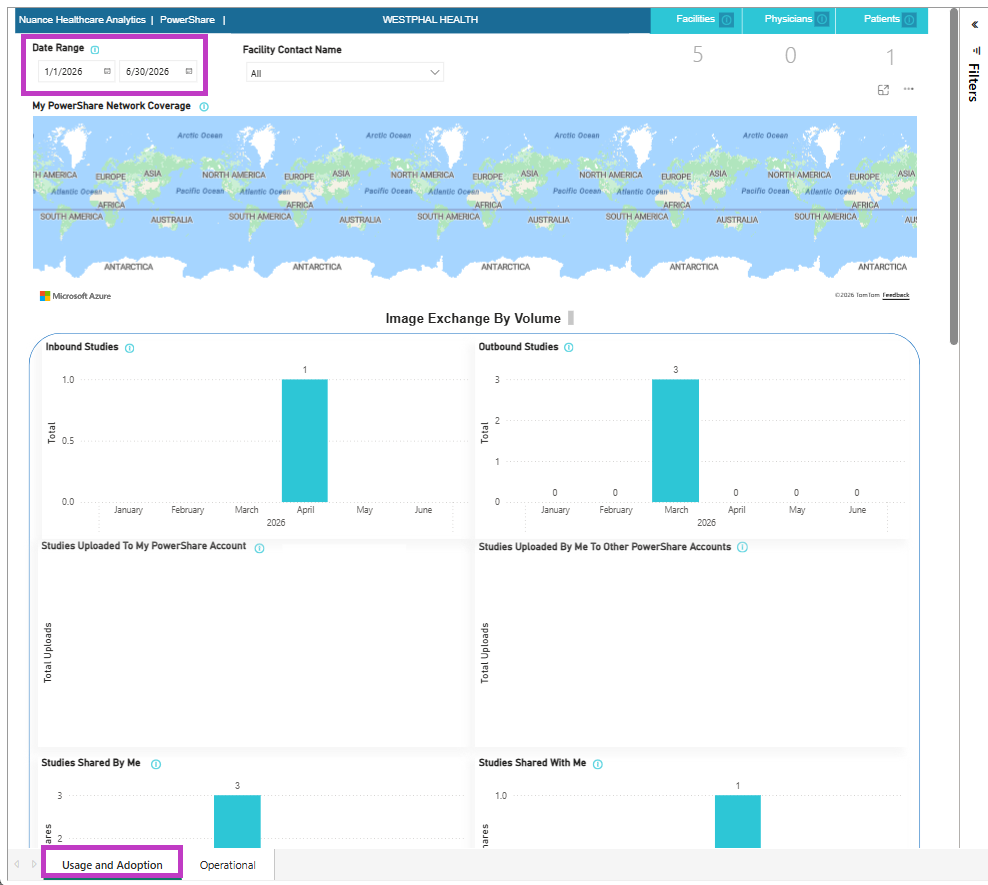
The Usage and Adoption tab shows how your network is growing.
View the number of:
Connected facilities
Physicians
Patients
Only accepted connections are included (pending invitations aren't shown).
By default, data shows the past six months, but you can change the date range.
Understand network coverage
Use the map view to see your PowerShare network coverage.
Zoom in or out to explore your network locations.
Explore image activity
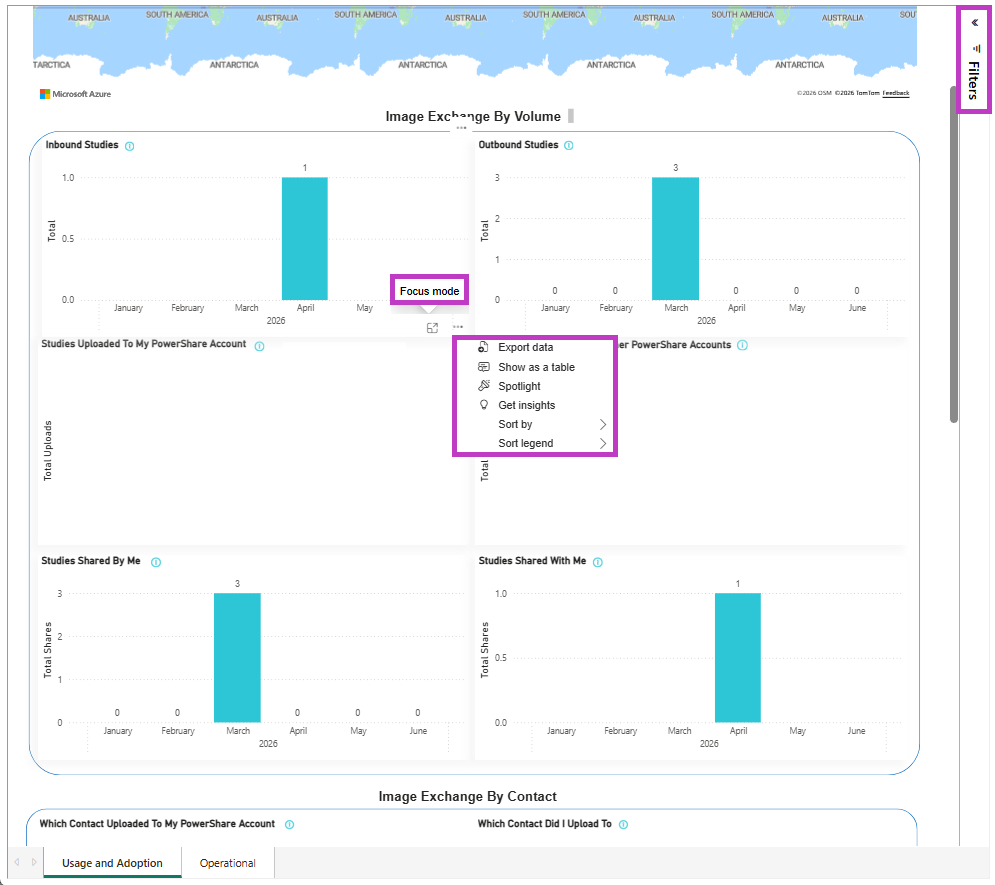
The dashboard includes visuals to track image workflows.
Uploads and shares
See how many studies are:
Uploaded to your account
Uploaded to other accounts
Shared by you
Shared with you
Upload and share metrics help you understand activity across your network.
Study upload insights
View the total number of studies uploaded to your account.
Identify upload methods, such as:
Accelerator
Easy Uploader
Standard Uploader
Upload activity might affect billing, depending on your setup.
Share activity
Track studies you share with your contacts.
Track studies your contacts share with you.
Sharing events has no associated cost.
Use filters and tools
You can customize how you view data:
Apply filters to refine results.
Hover over visuals to see detailed values.
Right-click visuals to view data in table format.
Use Focus Mode to expand visuals.
Export data to Excel (up to supported limits).
Analyse data by contact and method
Identify which contacts are uploading or sharing images.
Understand how images are sent and received.
Compare different sources and workflows.
View operational insights
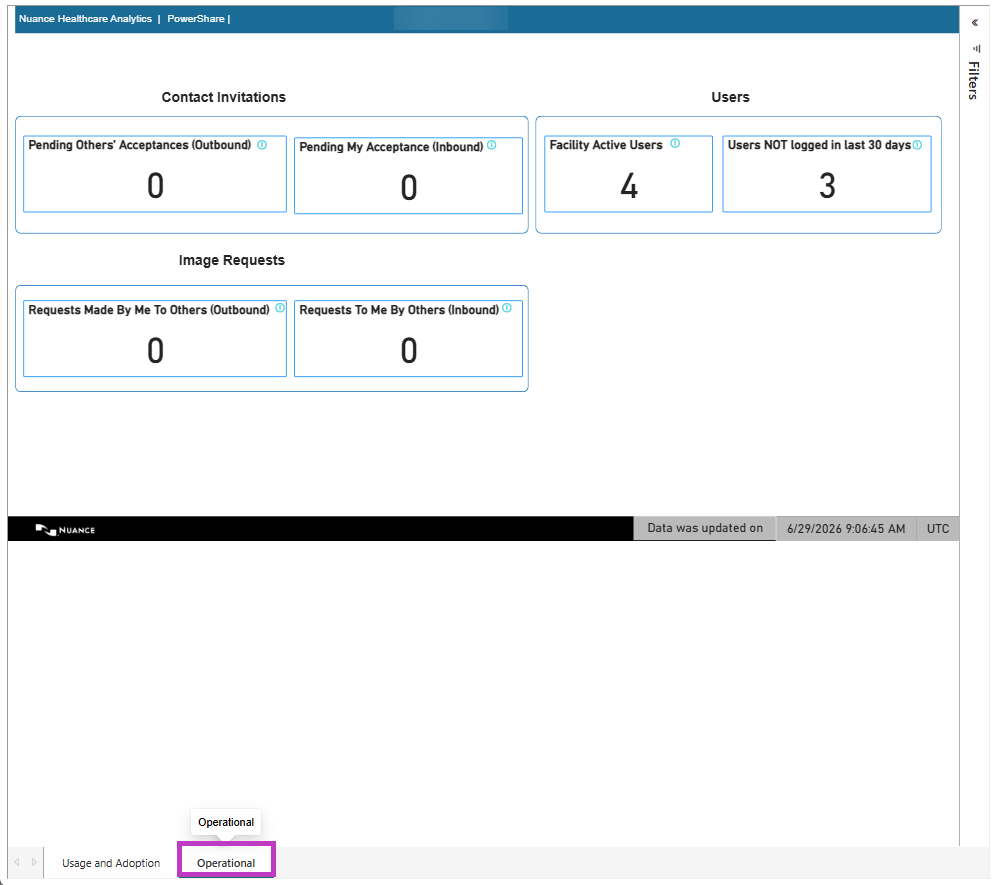
Select the Operational tab to view:
Pending contact invitations
Pending image requests
User-related activity
You can drill into and export this data similar to other reports.
Tip
- Use filters to focus on specific time periods or workflows.
- Check upload trends to monitor usage and growth.
- Review operational insights to track pending actions.
Next up: Support information in PowerShare Image Sharing
Learn when to contact PowerShare Support, find troubleshooting resources, and resolve common issues. Let's go